Claritix Insights
Before working with data in Power BI or Power Pivot, it’s essential to structure your data correctly so the data model and DAX can work with it. This process is carried out in Power Query, and here we...

Power BI is Microsoft’s data visualisation tool, designed to connect to data from multiple sources (via Power Query) and transform it into engaging, dynamic and interactive dashboards.
Consistently r...

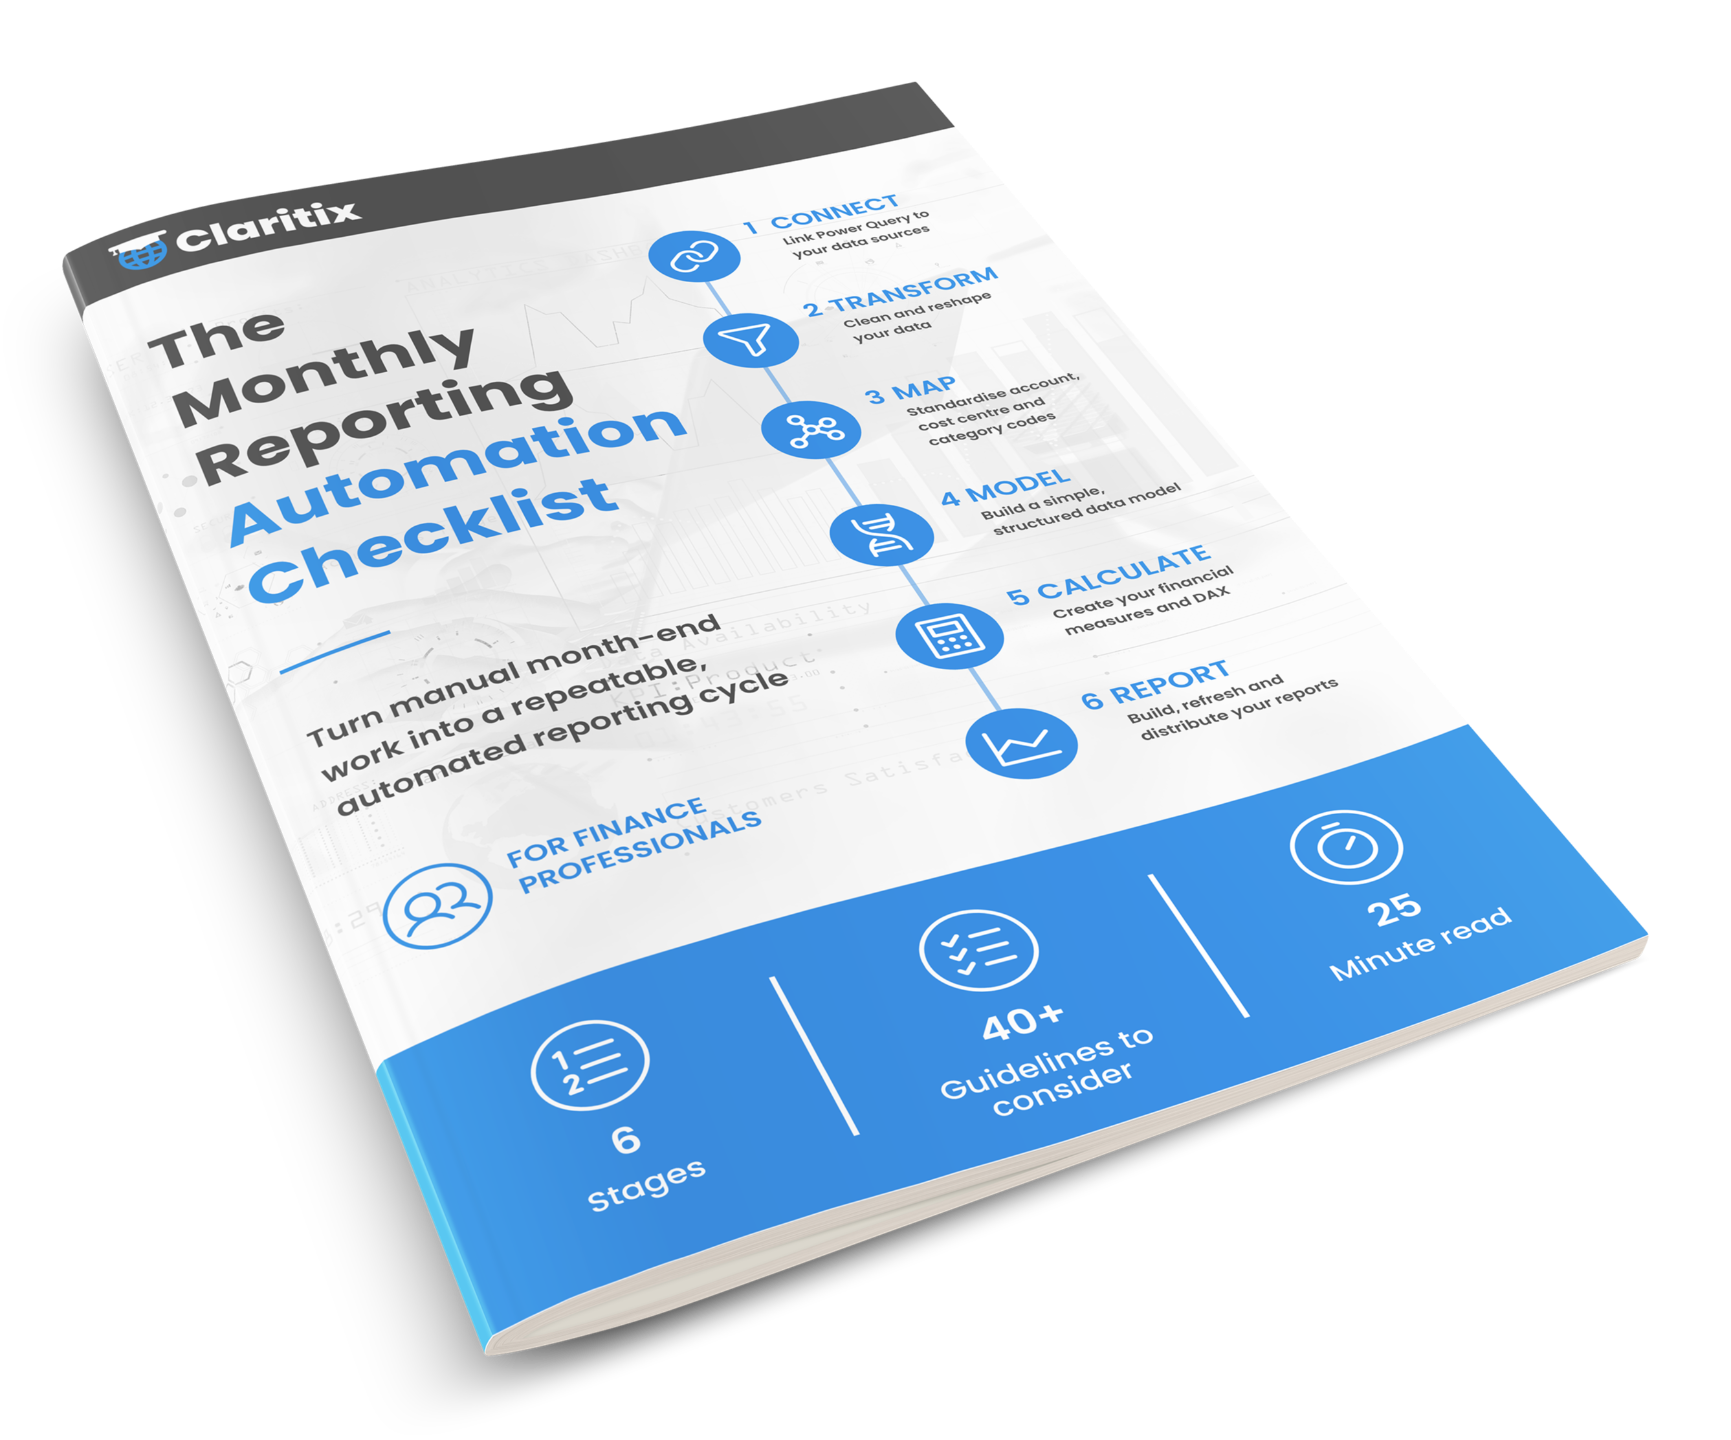
If you’re an accounting or finance professional looking to save time and deliver more insightful, reliable monthly reporting, Power BI can transform the way you work. This article walks you through th...

If you’ve spent any time building financial reporting in Power BI, you’ve probably experienced measure chaos. Measures often end up stored in whichever table was selected when they were created. Th...

In our previous financial reporting insights (see end of article), we covered how to use Power Query to automate the extraction, cleaning, and consolidation of data, and how data models in Power BI or...

In financial reporting, how your data is structured often determines how quickly and confidently you can analyse and report on it. Whether you're mapping your monthly accounts or rolling up quarterly ...

There are many advantages to producing our quarterly or monthly financial reporting in Power BI: it allows us to leverage more of our organisation’s data, including big data, all in one place; with Po...