
Python in Excel
Python in Excel
A practical beginner's course in using Python inside Excel to clean, merge, analyse and visualise larger datasets. No coding background required.
No previous Python experience needed. 4.5 hours of video, 12 months' access.
Enrol Now: £215 + VAT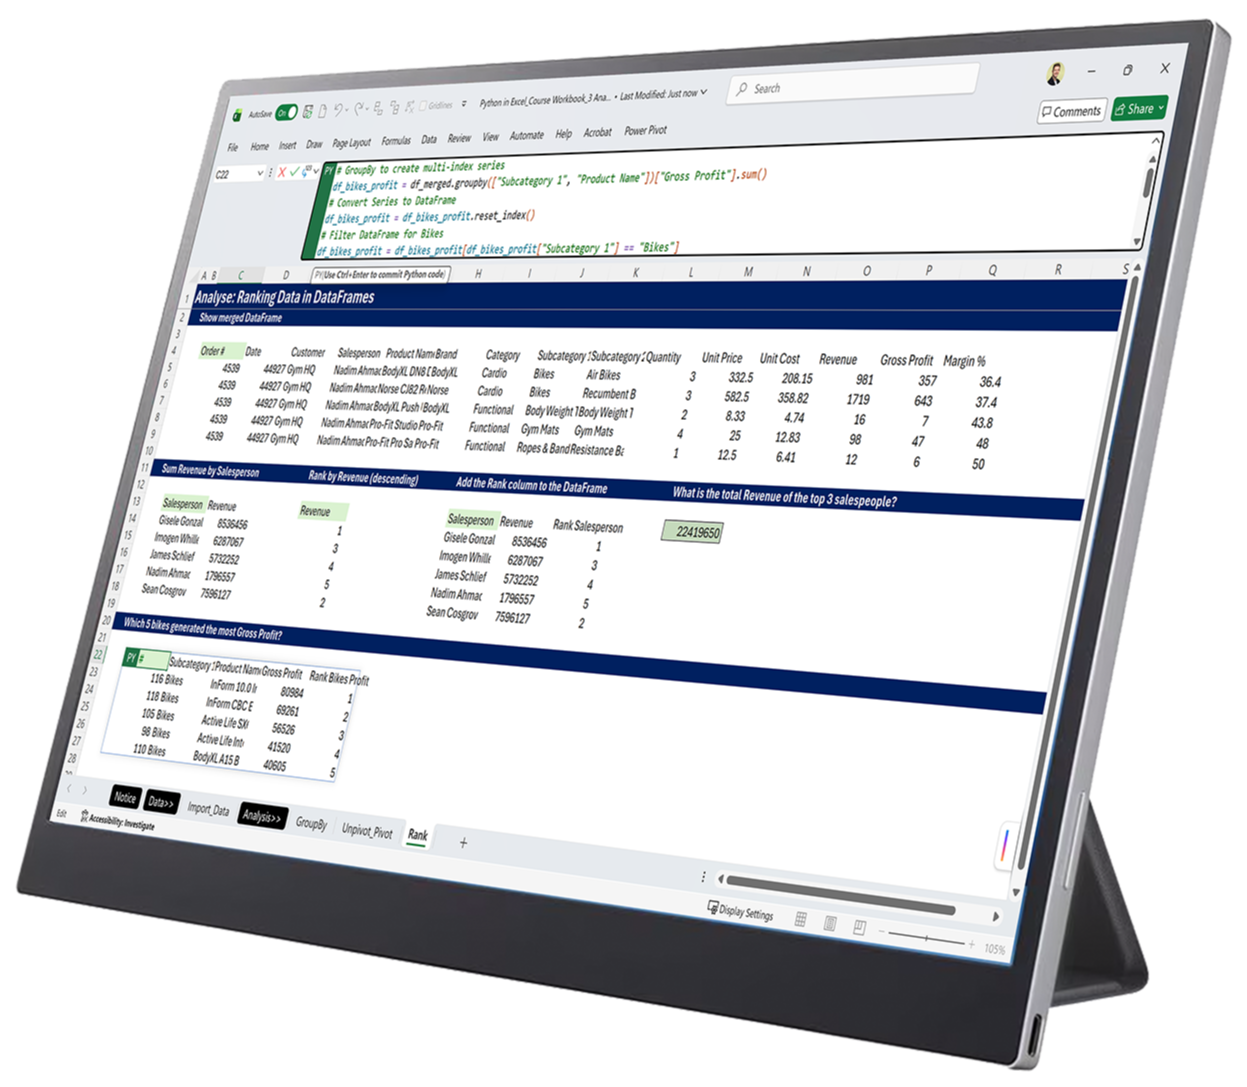















Is Python in Excel available to you yet?
Python in Excel is a newer Microsoft feature, and exactly when you get it depends on your Microsoft 365 plan. Most Business and Enterprise users on Windows already have access. To check, open Excel, go to the Formulas tab, and look for a Python option, or ask your IT team.
If you don't have it yet, that's fine. You can still start the course today: the video walkthroughs let you follow every step on screen, and the Python and Pandas skills you learn apply as soon as your access switches on. Microsoft keeps expanding availability, so this is a good time to get ahead of it rather than wait.
Who this is for
Who this course is for
Built primarily for accounting and finance professionals working with data in Excel, and also genuinely useful for any Excel user who wants to go beyond what formulas can comfortably handle.

Finance role
You work in accounting and finance, for example FP&A, financial control, commercial analysis, management accounting or consulting, and regularly handle data in Excel

Confident in Excel
You're confident in Excel day to day, but have never written a line of code in Python or any other language

Copilot-curious
You're curious how AI tools such as Microsoft Copilot are starting to write Python code inside Excel, and want to understand what that code is doing before you rely on it
This course is not:
- A software development or programming qualification. You won't finish as a professional Python developer, and that isn't the aim
- A course in advanced statistics, machine learning or data science. It teaches the practical Python skills you're likely to actually use in Excel
- The right level if you already use Python or Pandas regularly. This is a genuine beginner's course
Why it matters now
Why Python in Excel matters for accounting and finance now
Most financial reporting runs on formulas, Power Query and Power Pivot, and for most tasks, that's still the right toolkit. But formulas start to strain once a dataset gets large or messy, or once you need the same set of cleaning and transformation steps to run reliably every month. Python in Excel gives you a way to handle that inside the Excel grid you already know, using the Pandas library to merge, clean, transform and analyse data, and Matplotlib to visualise it.
There's a second, more immediate reason to learn it now. Microsoft Copilot in Excel can already generate Python code on request. That's genuinely useful, but only if you can read what it has written well enough to sense-check it before it goes into a report someone else relies on. This course gives you that working knowledge: enough to use Python in Excel yourself, and enough to understand, review and safely edit the code Copilot writes for you, rather than accepting it on trust.
What you will be able to do
By the end of the course, you'll be able to:
✓ Import a dataset into Excel and work with it as a Python DataFrame
✓ Clean and prepare messy data: rename, reorder and remove columns, and fix inconsistent entries
✓ Merge multiple data sources together, similar in spirit to INDEX/MATCH or XLOOKUP, but built for much bigger data
✓ Filter and sort data using multiple criteria at once
✓ Group, pivot and rank data to answer commercial questions or to create summaries
✓ Create simple pie, bar and line charts to visualise your results
✓ Read a piece of Python code, particularly one written by Copilot, and understand broadly what it's doing before you rely on it
Practical finance use cases
How finance professionals use Python in Excel
The course is taught using a fictional case study company, Workout Warehouse, but the techniques map directly onto real accounting and finance work. For example:
✓ Cleaning and consolidating large transactional exports from an ERP or finance system before they're usable in a report
✓ Grouping and summarising cost or revenue data by cost centre, department or product line
✓ Building a repeatable set of data-cleaning steps once, so month-end processing takes minutes rather than hours
✓ Producing a quick visual summary, such as a trend chart or breakdown, for a management report
✓ Reading and sense-checking Python code that Copilot generates for a finance task, so you understand what it's done to your numbers before you present them
Course content
What the course covers
4 topic groups · 4.5 hours of video · 4 quizzes
Build from the basics through to your own visualisations:
Fundamentals
Transform
Analyse
Visualise
How the course works
How the course works
Every topic is taught through short video lessons, followed by a video walkthrough you can follow along with using the downloadable course data. Regular quizzes throughout test your understanding as you go.

Short video lessons
Explaining and demonstrating each topic

Video walkthroughs
Follow along using downloadable course data
Workout Warehouse data
Realistic product, customer and sales data

4 quizzes
Check your understanding as you go

Instructor Q&A
Post a question on any module, get an answer from the instructor
Certificate & CPD
Earn a certificate. Support your CPD.
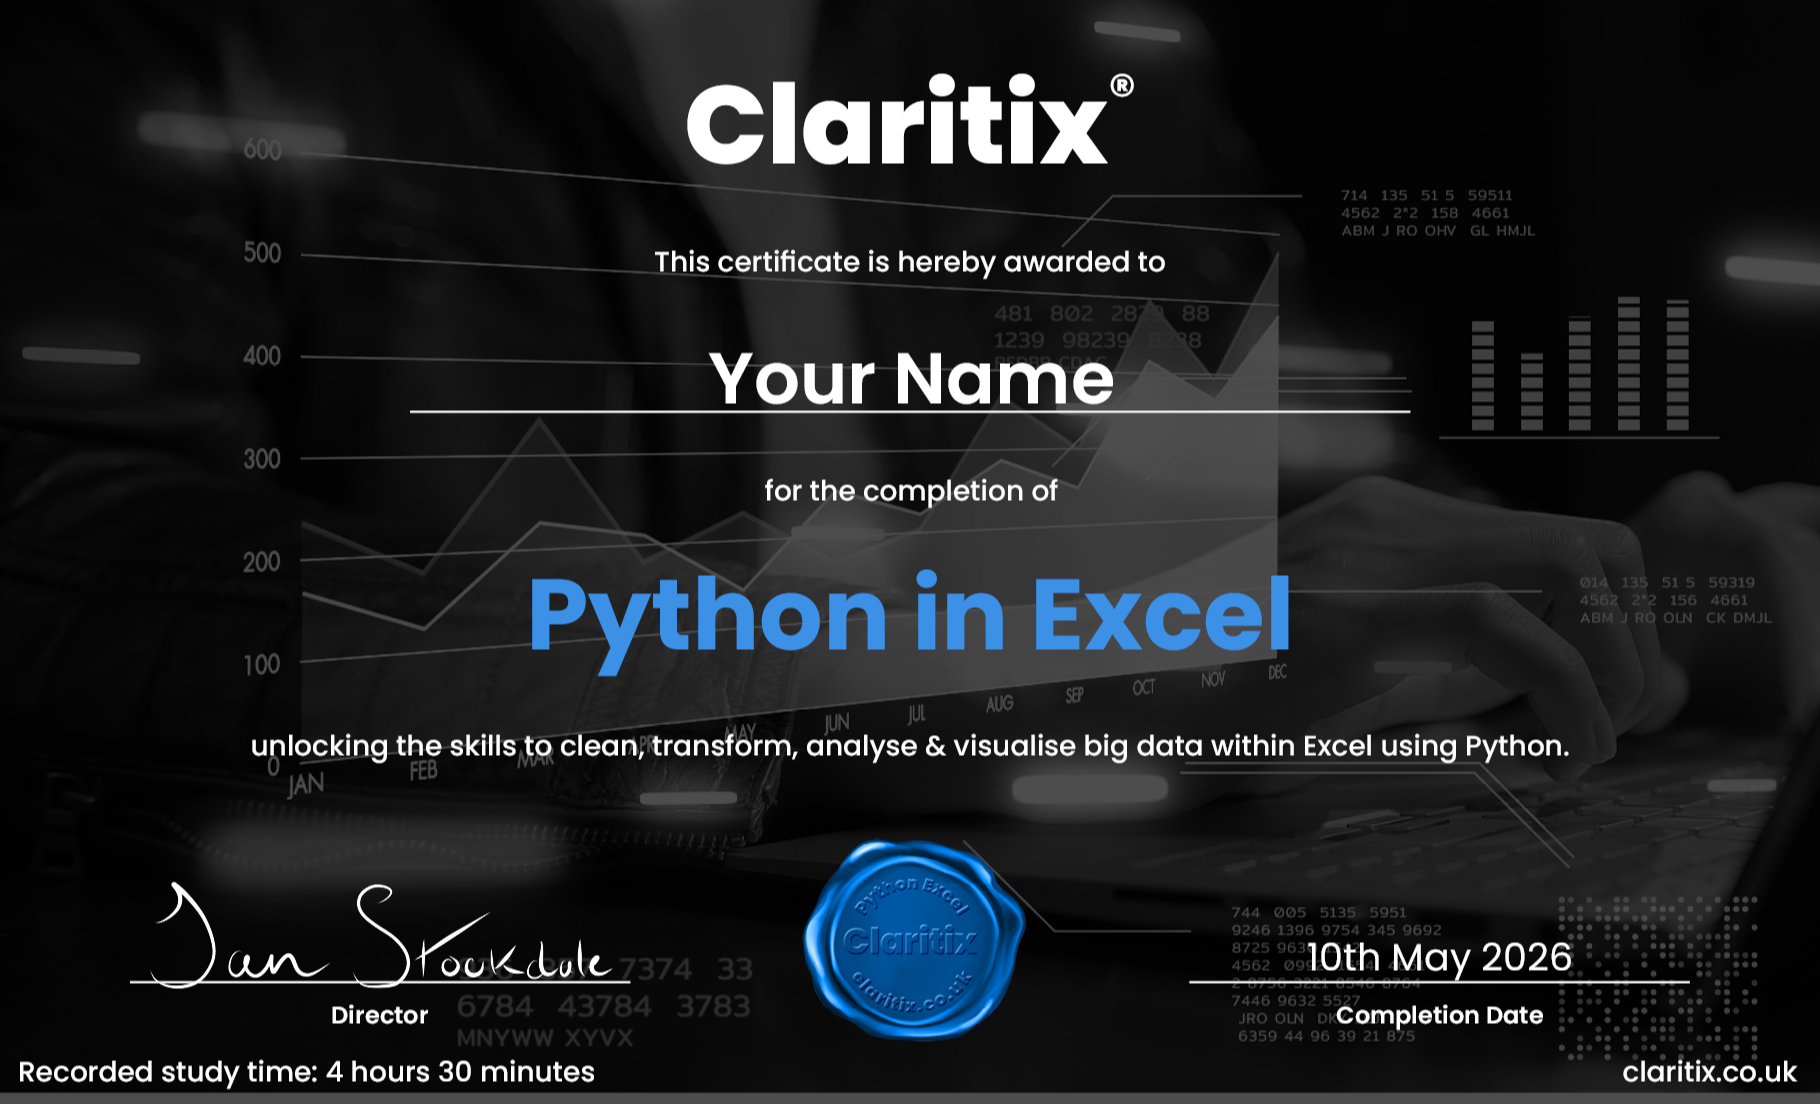
On completion you’ll receive a personalised PDF certificate showing your name, the course title, completion date and your recorded study time, designed to support CPD record-keeping.
Whether you are working towards a CIMA, ACCA, ICAEW, or CIPFA CPD commitment, this course provides verifiable evidence of structured learning. A VAT receipt is available following purchase, making it straightforward to expense through your employer’s training budget.
If you're outside the UK, particularly in the US, please check your professional body's specific requirements before relying on this certificate for CPD/CPE purposes. Claritix courses are not currently certified by NASBA.
About the course creator
About your instructor

Dan Stockdale
CIMA-qualified (ACMA, CGMA) · 19+ years in finance · Former PwC consultant
Dan Stockdale is the practitioner behind every Claritix course, including this one. He's CIMA-qualified with over 19 years of finance experience, including time as a financial modelling consultant at PwC, where he co-trained fellow consultants.
Dan isn't a software engineer, and this isn't a computer science course. He learned Python in Excel to solve the same data problems accounting and finance professionals face, and built this course to teach exactly what you need to apply it at work, not a full programming curriculum.
Free resource
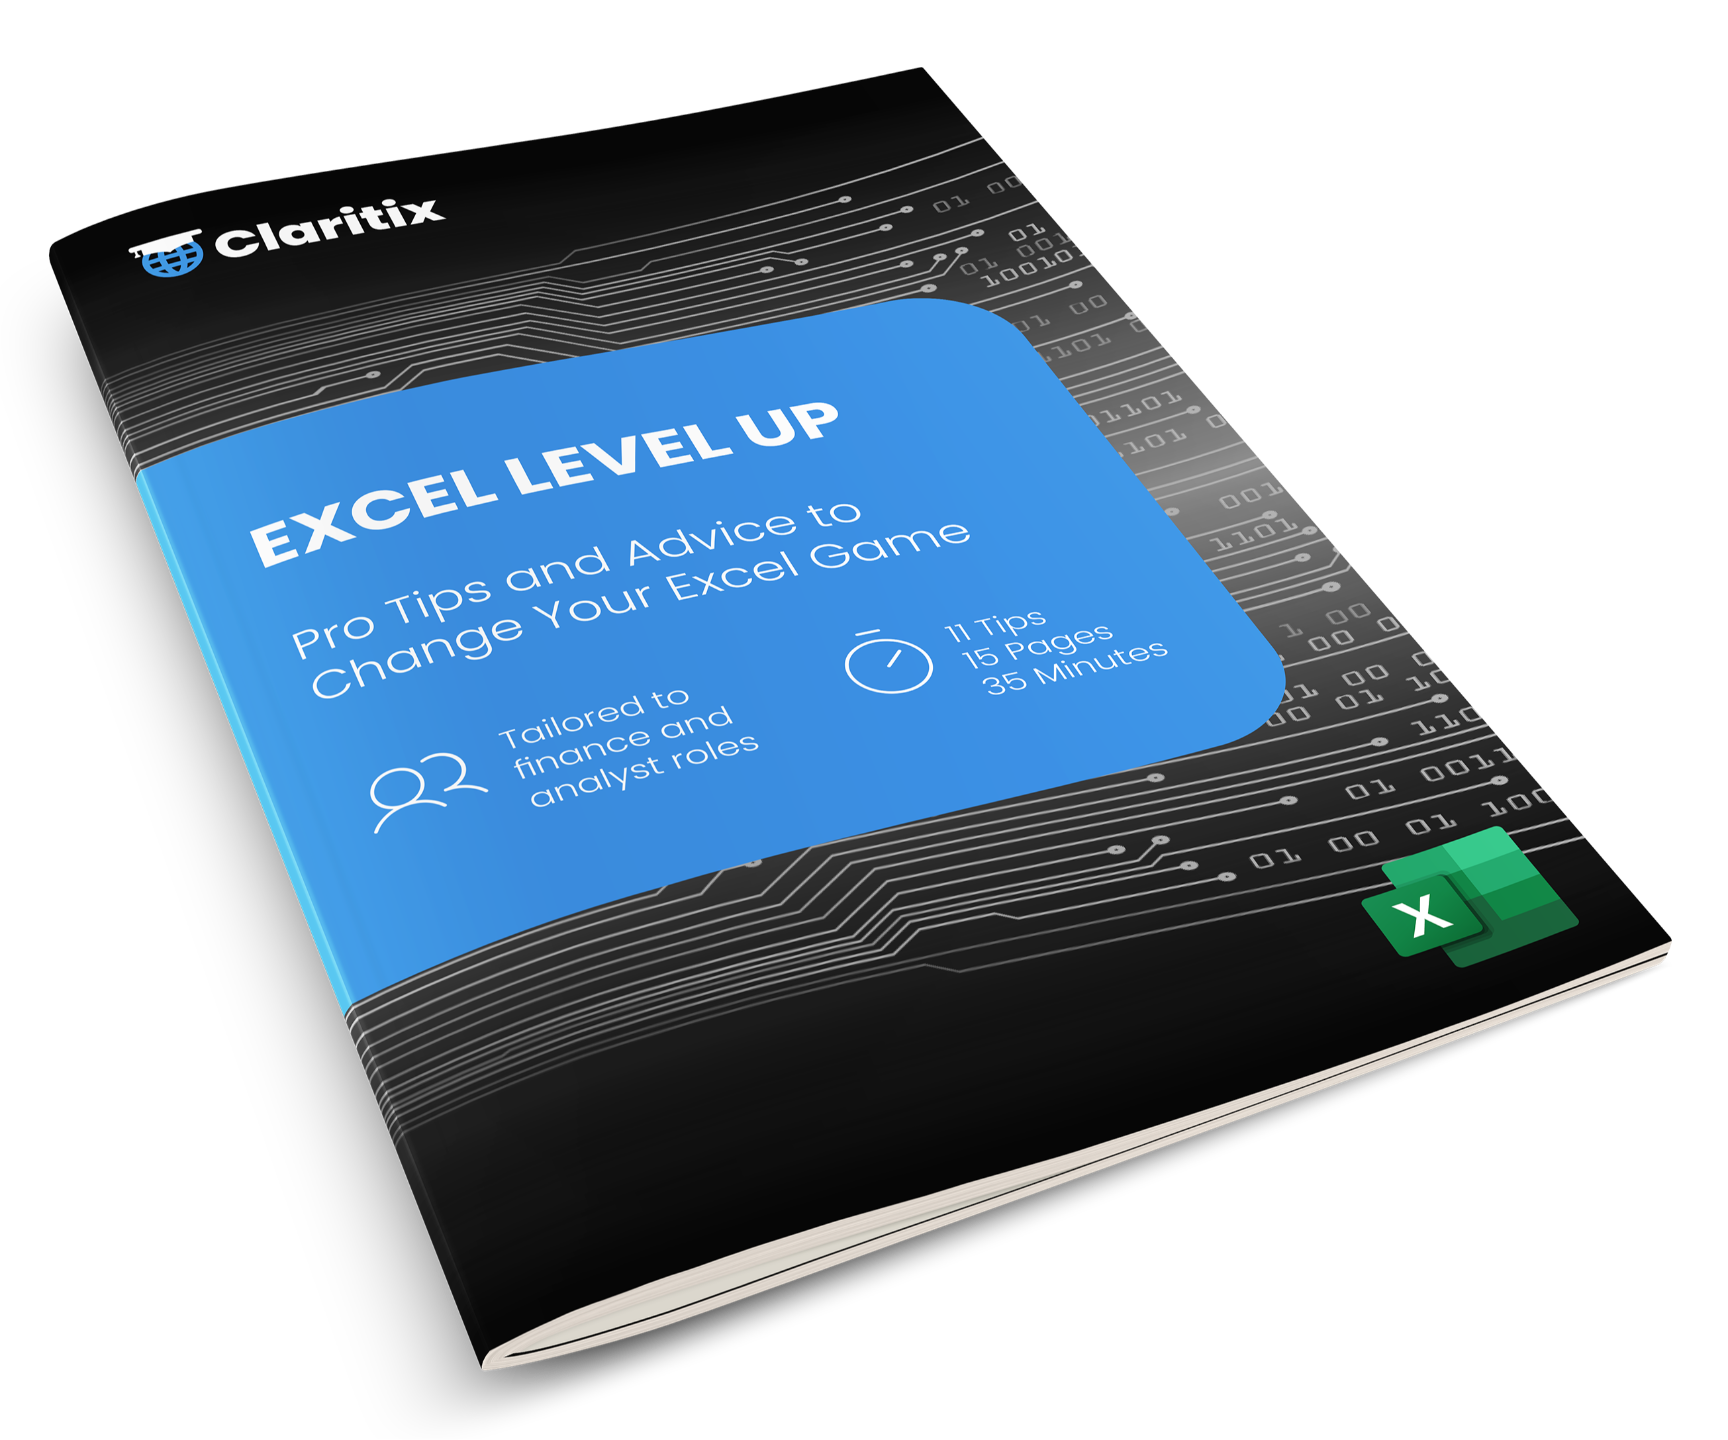
Not ready yet? Start with our Top 10 Excel Tips
Get a free taste of our style with the Excel Tips eBook, sent straight to your inbox.
Sign up below and we will send it straight to your inbox. No spam. Unsubscribe at any time.
By subscribing you agree to your data being stored and receiving occasional marketing emails.
Pricing
Invest in yourself
One payment. No subscription, no auto-renewal.
FAQ
Frequently asked questions
Do I need any coding experience to take this course?
Will this actually help with the reporting or analysis work I do, or is it more abstract?
Is Python in Excel available in my version of Excel?
Is my data safe if Python in Excel processes it in the cloud?
Is Python in Excel a passing trend, or a skill worth learning now?
Will I get downloadable files and exercises, or is it video only?
Can I expense this course, or use it for CPD?
How long will the course take?
Why should I trust Claritix on a Python course, given Dan's background is in finance rather than software development?
Should I buy this course on its own, or get the Big Data Bundle?
Ready to start?
Ready to get started?
No coding background needed, and no need to wait for the right moment. 4.5 hours of practical, accounting and finance-relevant Python in Excel training, taught by a finance practitioner.
12-month access · No subscription · CPD certificate included · Immediate access on purchase