
POWER AUTOMATION BUNDLE
Stop rebuilding reports by hand. Stop being asked for ‘one more cut’ of the data.
This bundle combines both automation courses so you can solve monthly reporting from both directions: number-focused reports and dashboards, built once in Power BI, Power Query and Power Pivot, and refreshed with a click every month after. Built for finance professionals, taught by one.
- Build both number-focused Excel reports and interactive Power BI dashboards, from one connected data model
- Automate the data preparation behind every report, not just the finished output
- Cover monthly reporting end to end: 9 reports, 2 courses, one shared skillset
- Save £125 versus buying the two courses separately
12-month access to both courses · No subscription · Two CPD certificates included
Enrol Now: £465 + VAT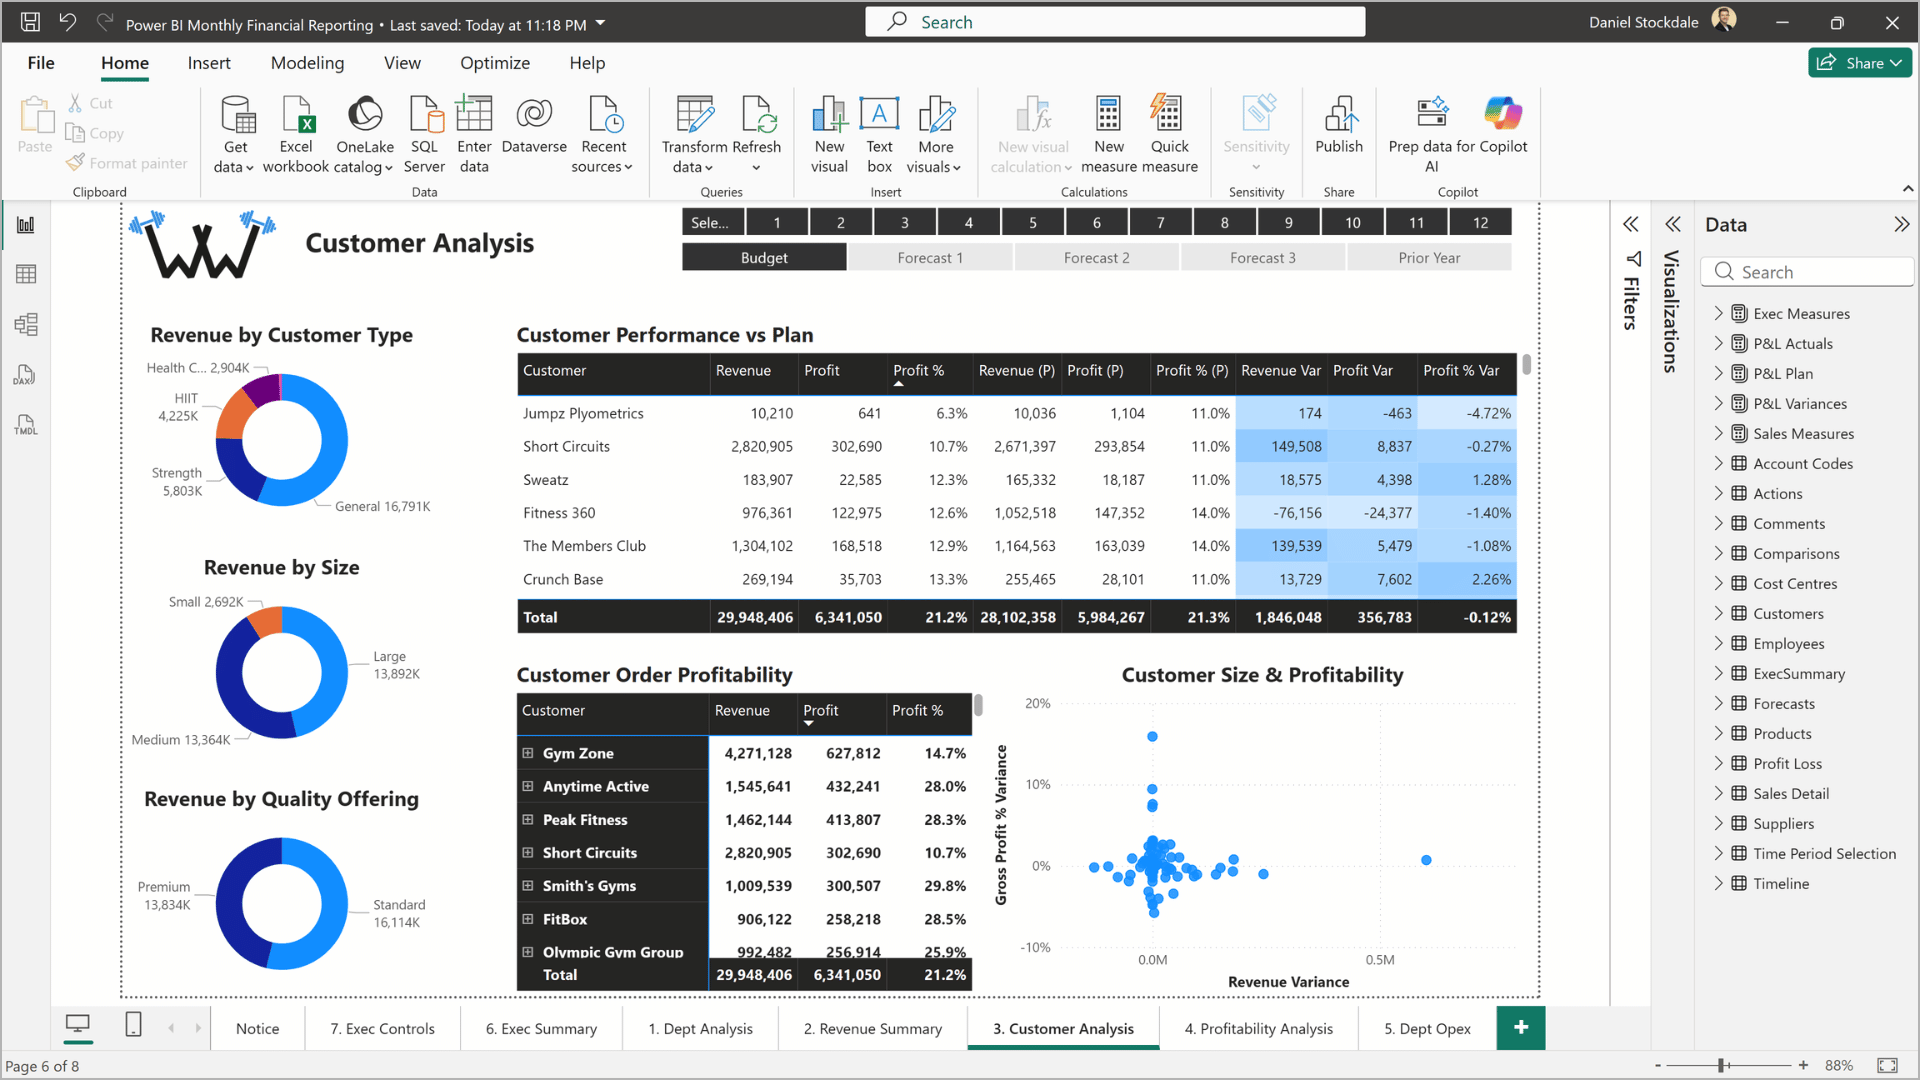
Customer analysis: compare and analyse performance versus a selected forecast (Power BI)
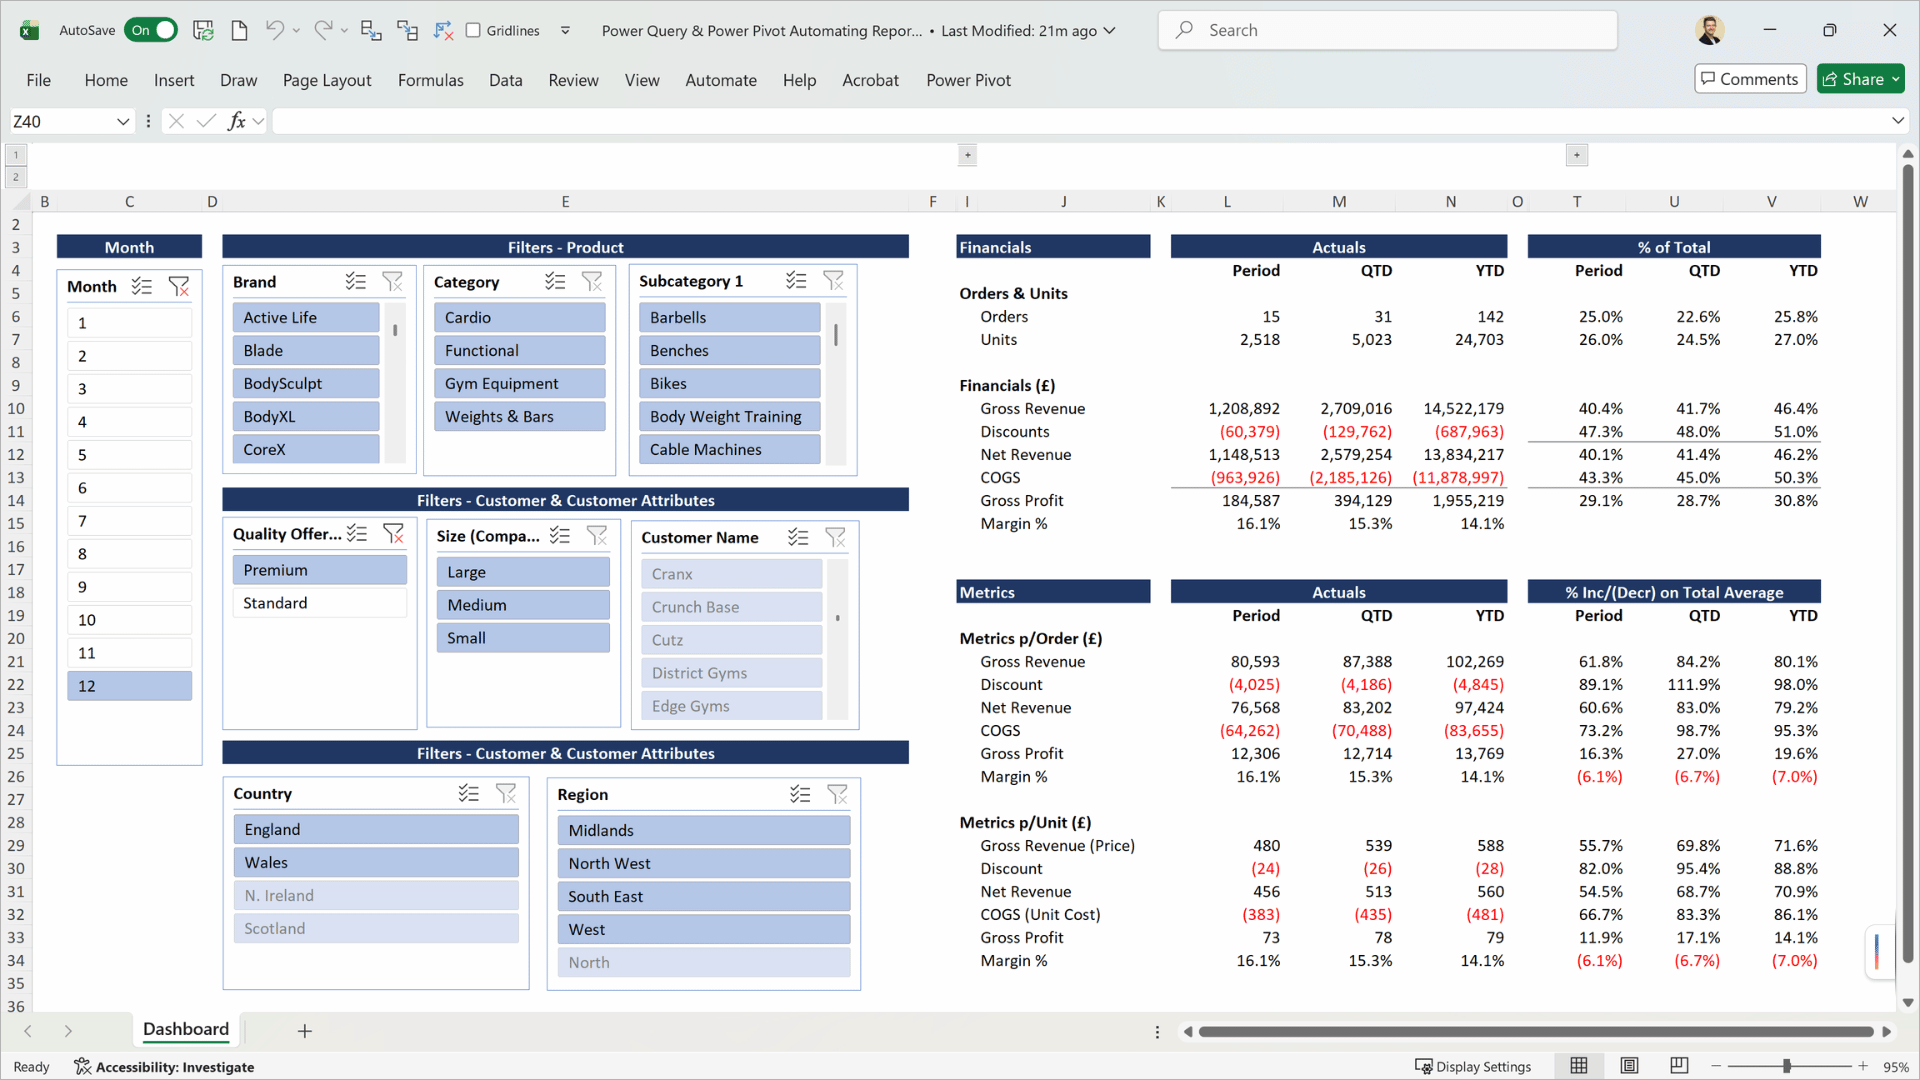
Sales dashboard: apply slicers in Excel to filter large datasets in the data model, instantly returning key financial metrics (Power Query & Power Pivot)














The PROBLEM
The same manual month-end, from two directions.
Finance teams lose hours every month to manual reporting, then lose more time answering the questions that follow once it is sent.
✗ Manual numbers
P&Ls, variance reports and sales analysis rebuilt from raw data by hand, every month, the same way.
✗ No self-service
Without a dashboard, every follow-up question is another data request landing back on Finance.
✗ Fragmented tools
Reporting split across disconnected spreadsheets, with no shared data model behind any of it.
The solution
What if both sides of reporting refreshed themselves?
Power BI and Power Pivot share the same underlying technology. Set both up once, and every month thereafter, number-focused reports and visual dashboards update at the click of a button.
✓ Automated numbers
P&Ls and reports update themselves in Excel, refreshing at the click of a button instead of by hand.
✓ Self-service dashboards
Power BI lets stakeholders filter, drill down and explore for themselves, without coming back to Finance.
✓ One shared workflow
Power BI and Power Pivot are built on the same Power Query > data model > DAX workflow and can even share the same data model, helping to keep outputs consistent.
Why both
One skillset, two reporting problems solved
Both courses are built on the same underlying technology: Power Query, a data model, and DAX. Learn it once, and the second course is mostly about applying what you already know to a different output, not starting again from scratch.
Power BI produces interactive dashboards that stakeholders explore themselves in a browser. Power Query & Power Pivot produces number-focused reports that live in Excel. Most finance teams end up needing both.
✓ Shared foundation: learn Power Query, the data model and DAX once, apply it to both outputs
✓ Different outputs: interactive Power BI dashboards for stakeholders, number-focused Excel reports for Finance
✓ End-to-end automation: covers the numbers and the visuals, not just one half of monthly reporting
✓ Bigger data, handled properly: combine data from multiple systems, cost centres or entities without strain
Who this bundle is for
This bundle is for you if…
Built for accounting and finance professionals with regular reporting responsibilities.

Finance role
You work in FP&A, management accounting, financial reporting, or a similar finance function

Regular reporting
You produce monthly or regular reports, in Excel, in Power BI, or both

Limited experience
You have little or no experience of Power BI, Power Query or Power Pivot

Aim to automate
You want number-focused Excel reports and stakeholder dashboards both update themselves
What you need to know already: No prior experience of Power BI, Power Query or Power Pivot is required for either course. For Power BI, if you can build a PivotTable, you're ready. For Power Query & Power Pivot, you should be comfortable writing a formula, for instance using VLOOKUP/XLOOKUP or SUMIFS. Note: Power BI Desktop and Power Pivot are both Windows features, not available in Excel or Power BI for Mac.
Course content comparison
The two courses, side by side
Both courses utilise the same underlying technology: Power Query, a data model, and DAX. How they are built, what they produce, and who they are for, is genuinely different.
▶ 2 minutes
Which one should you start with?
Which course should you start with?
The order doesn't matter technically – both use the same fictional company and datasets. If you're confident you only need one output, buy that course on its own. Buy the bundle when you know you need both, or expect to.

Start with Power BI if…
You mainly need to stop fielding requests for ‘one more cut’ of the data, and want stakeholders to self-serve.

Start with Power Pivot if…
You mainly need to stop manually rebuilding your P&L and Excel reports every month.

Do both if…
Your team is responsible for both types of output, or you know you'll need to be before long.
Course outcomes
Examples of the reports you'll build
Two reports from each course, built using the Workout Warehouse dataset.
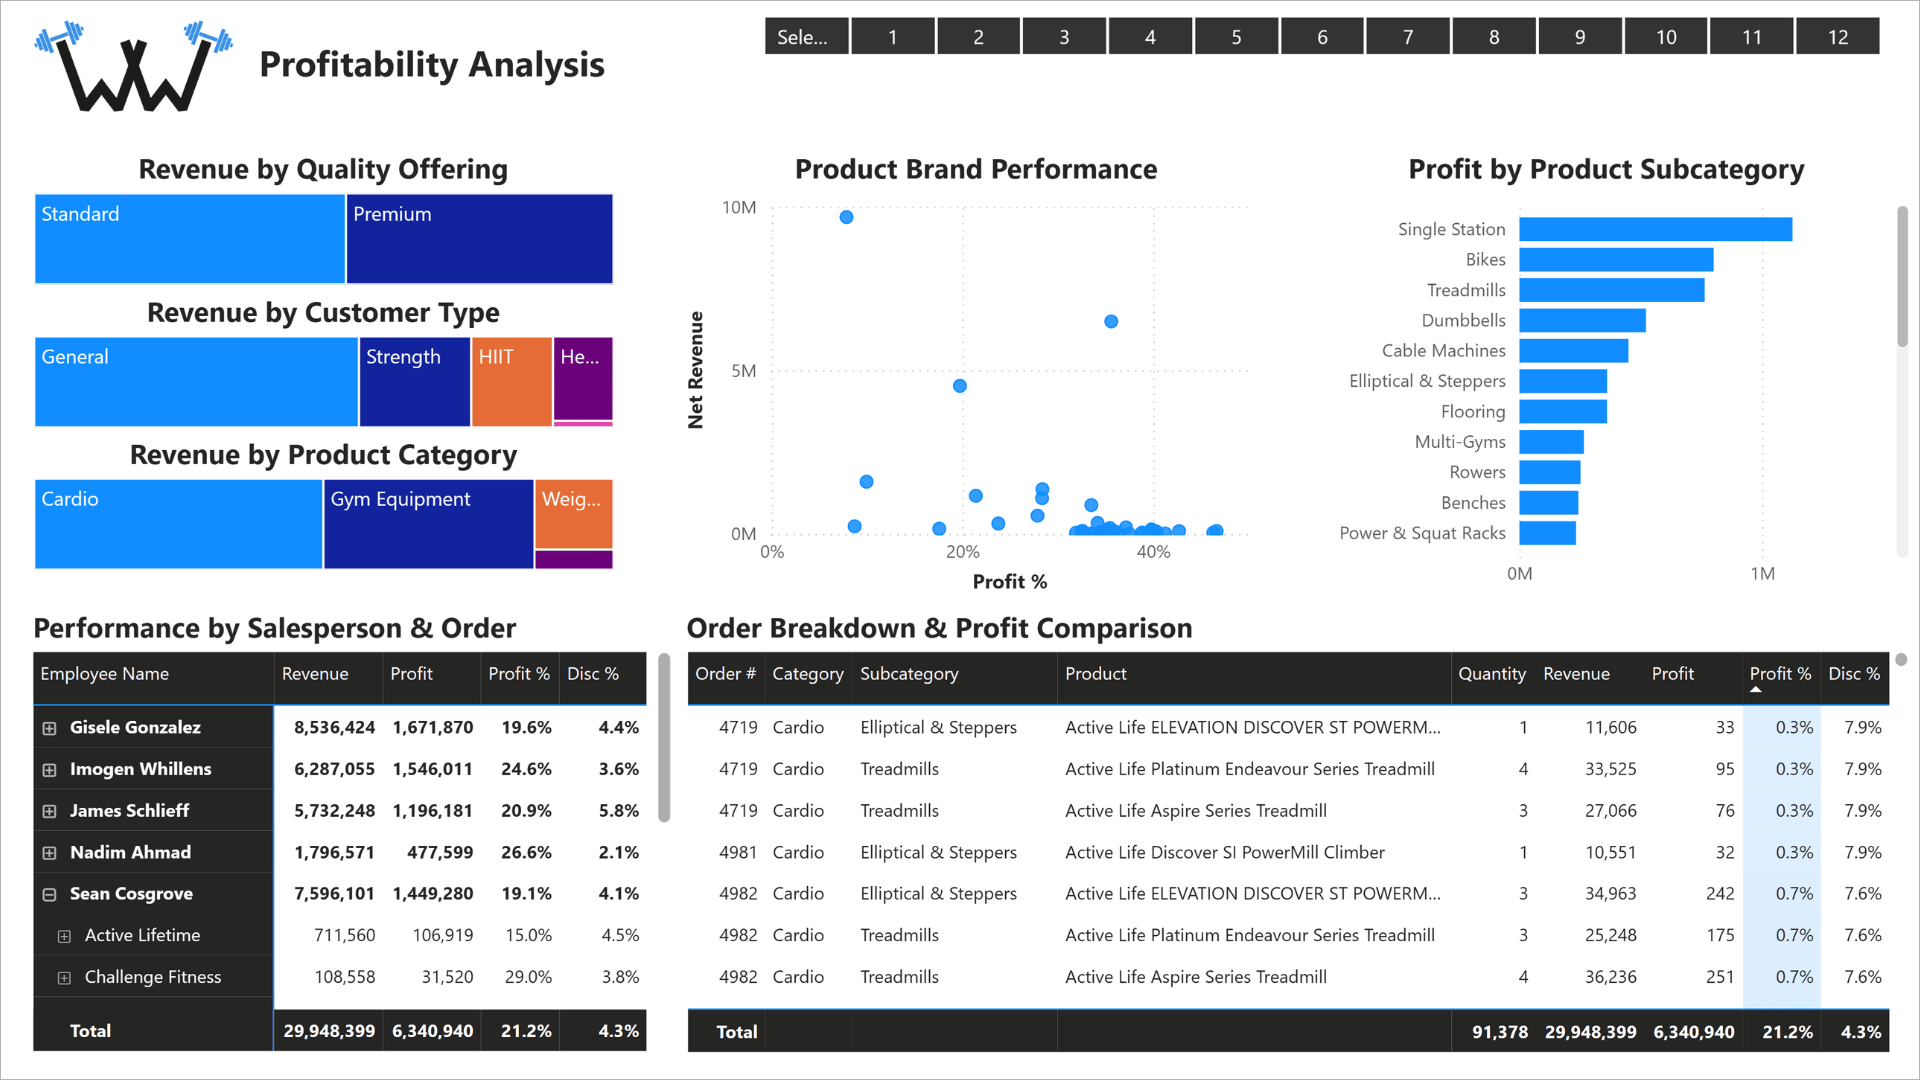
Profitability analysis: generate commercial insight from big data (Power BI)
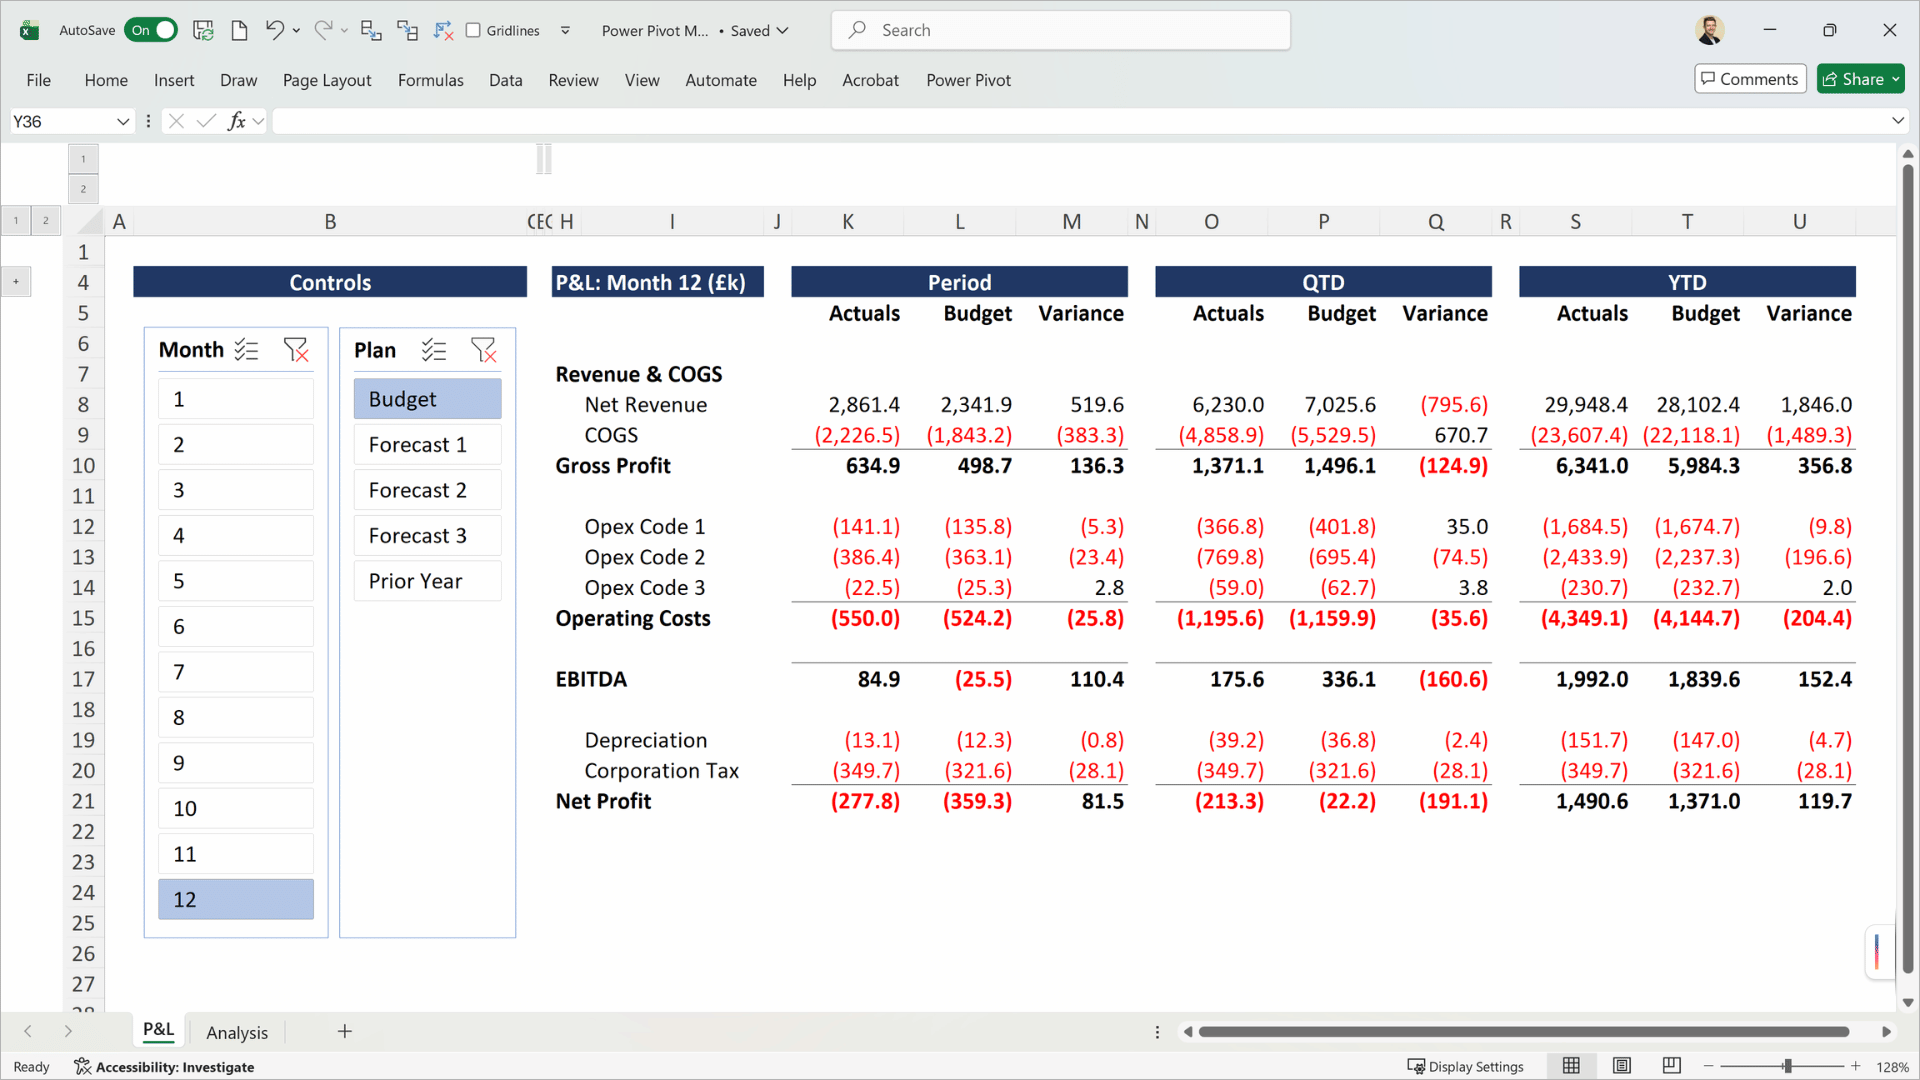
P&L (abridged): present actuals by Period, QTD, YTD versus the selected forecast by filtering the underlying data model (Power Query & Power Pivot)
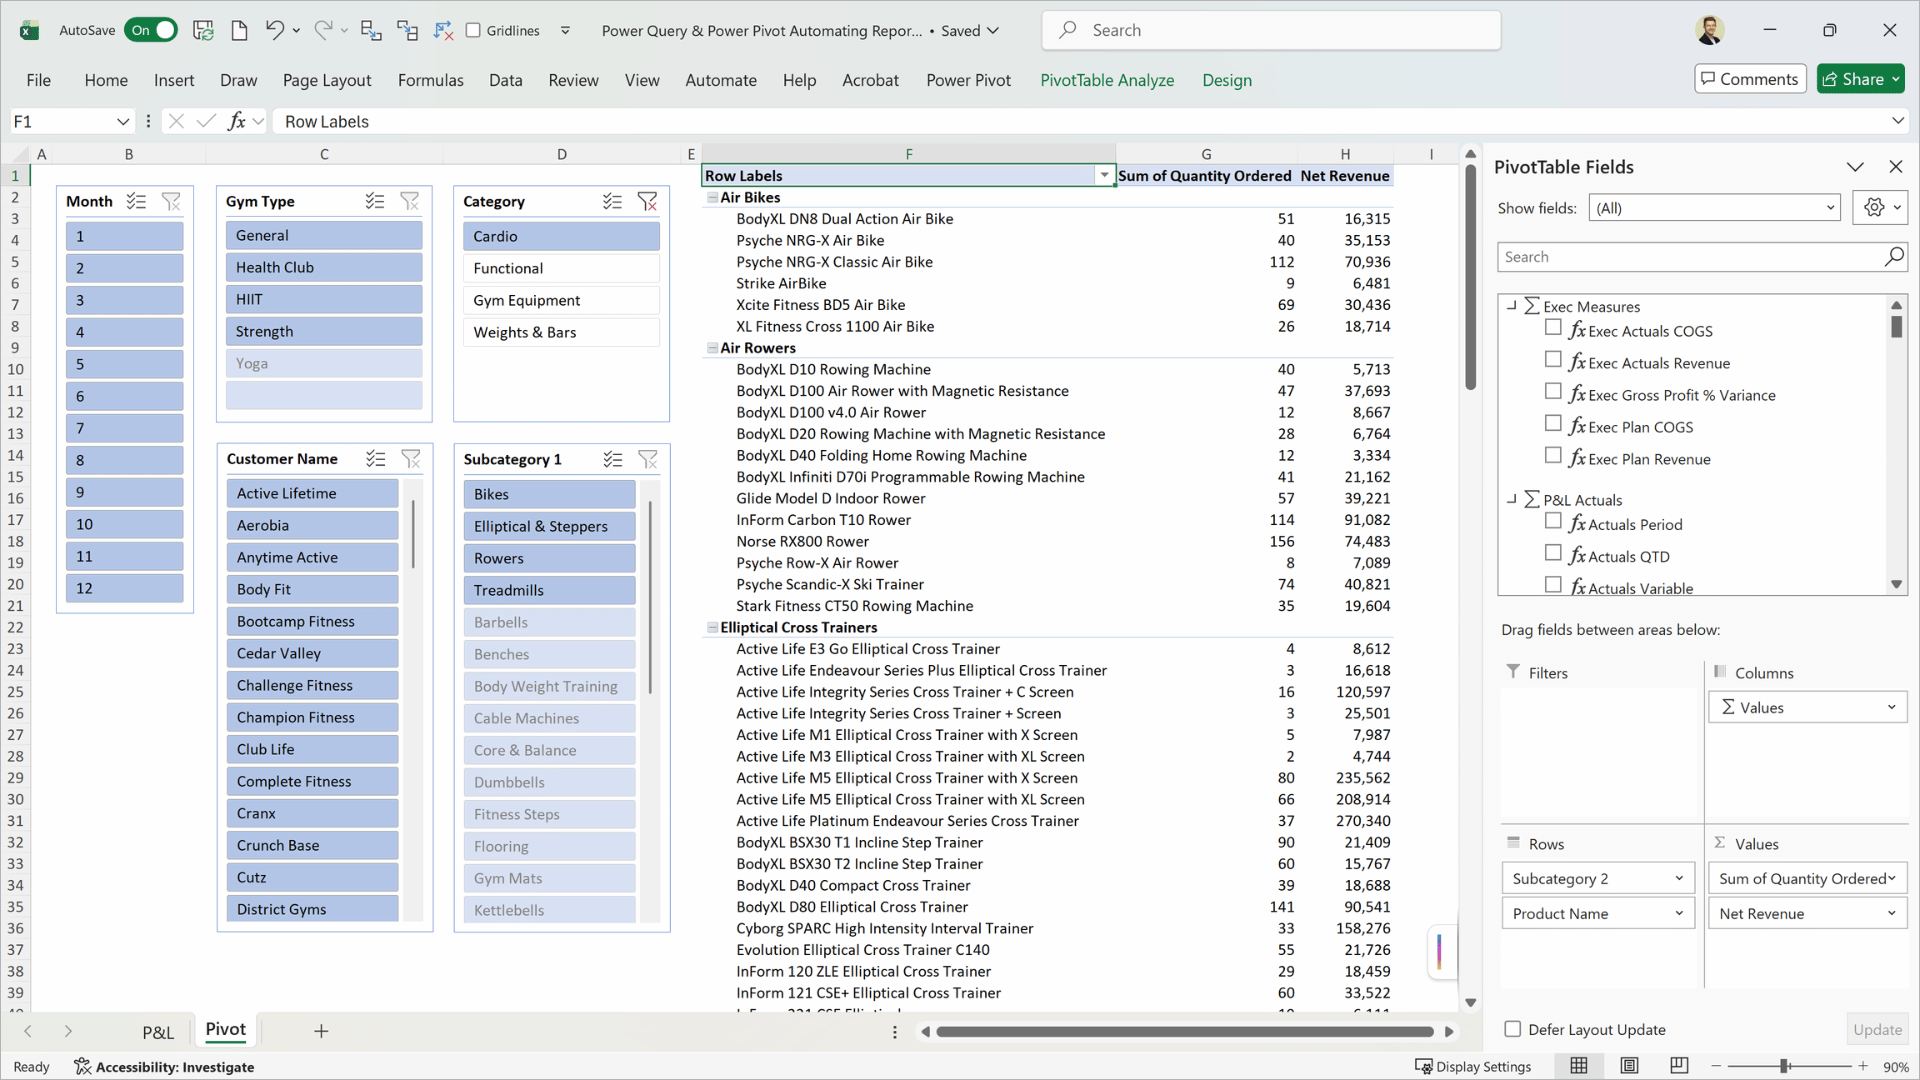
PivotTables: connect to and explore big datasets sitting in the data model (Power Query & Power Pivot)
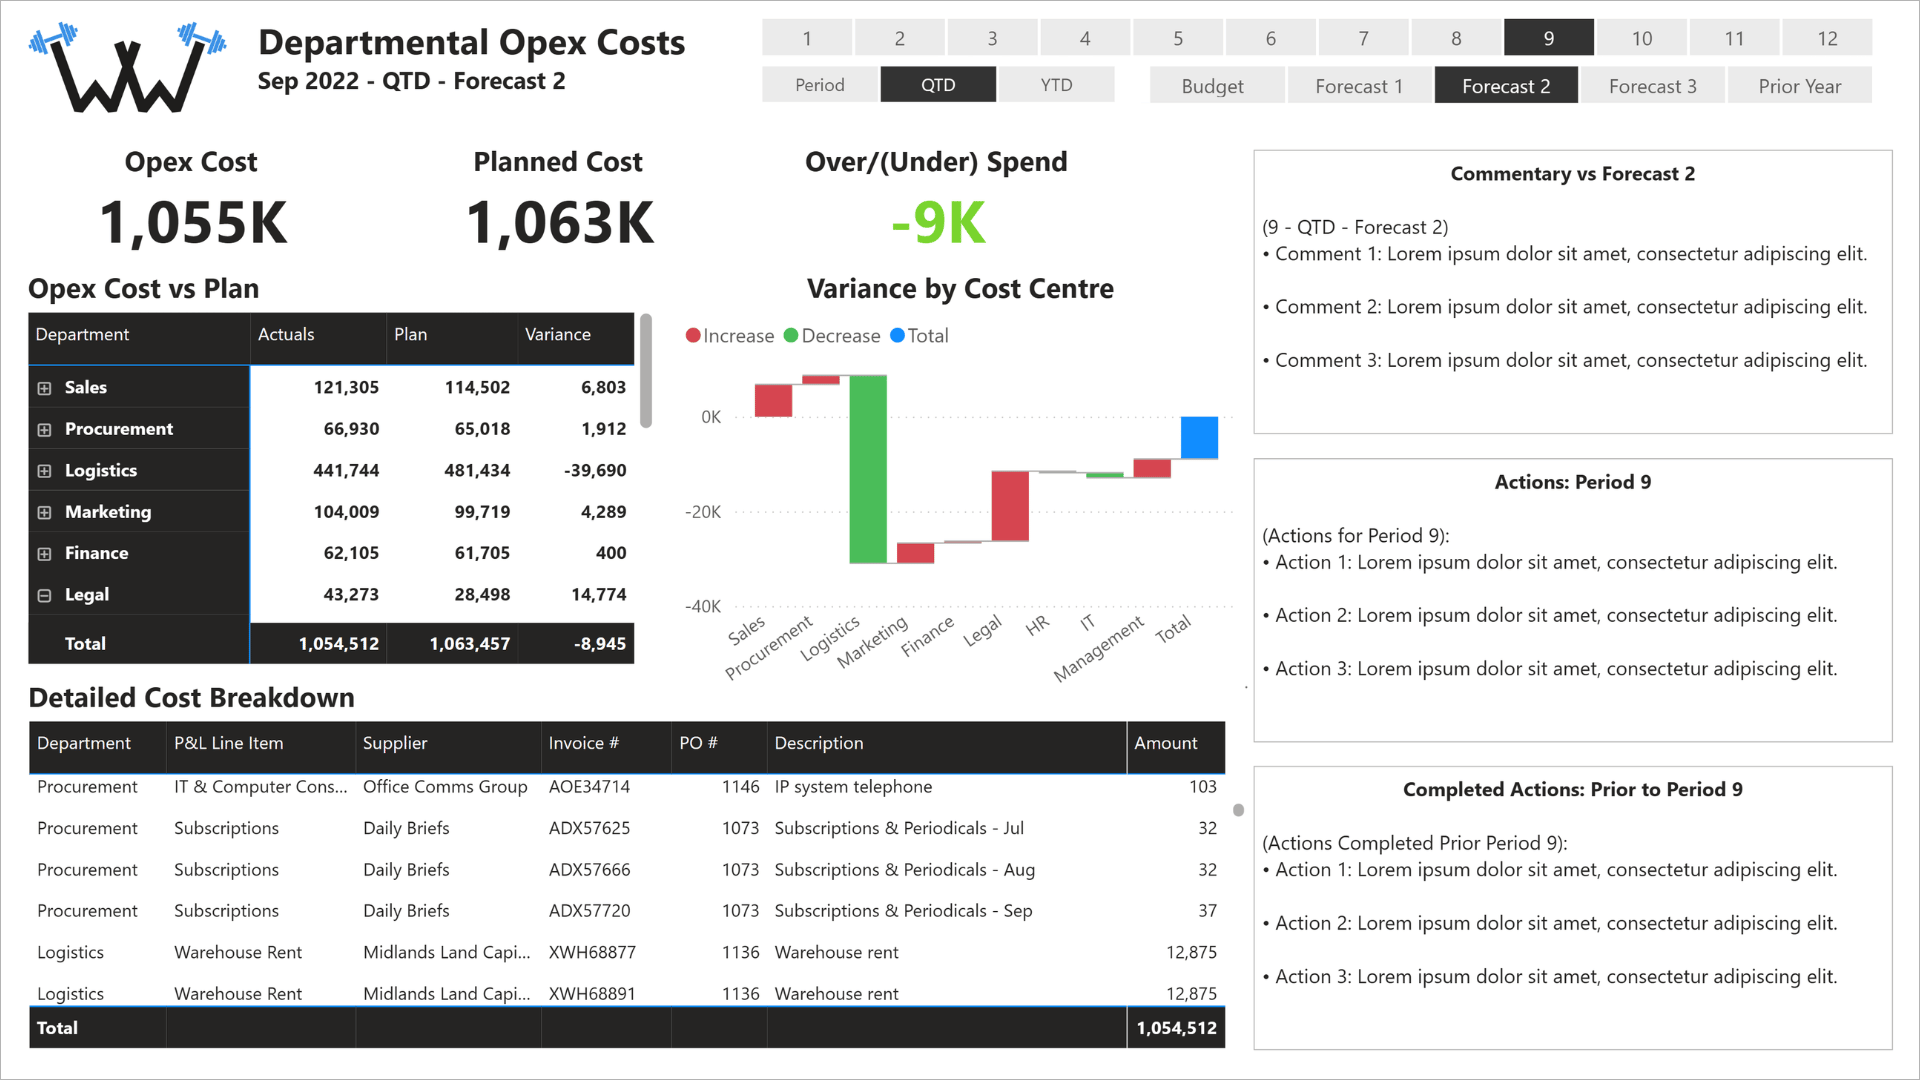
Departmental opex costs: align commentaries with data by Period, QTD, YTD (Power BI)
What is included
Everything in both courses, together
Not just two sets of videos. A complete package for both courses to learn from, practice with, and apply immediately.

Two slide decks
92 pages and 63 pages, downloadable full course theory

9 reports built
6 visual dashboards (Power BI) + 3 number-focused reports (Excel)
Shared datasets
Actuals, budget, forecast 1-3, and prior year financial data, based on fictional gym equipment wholesaler

10 quizzes, 5 challenges
Test your understanding and apply it practically at each stage

Two CPD certificates
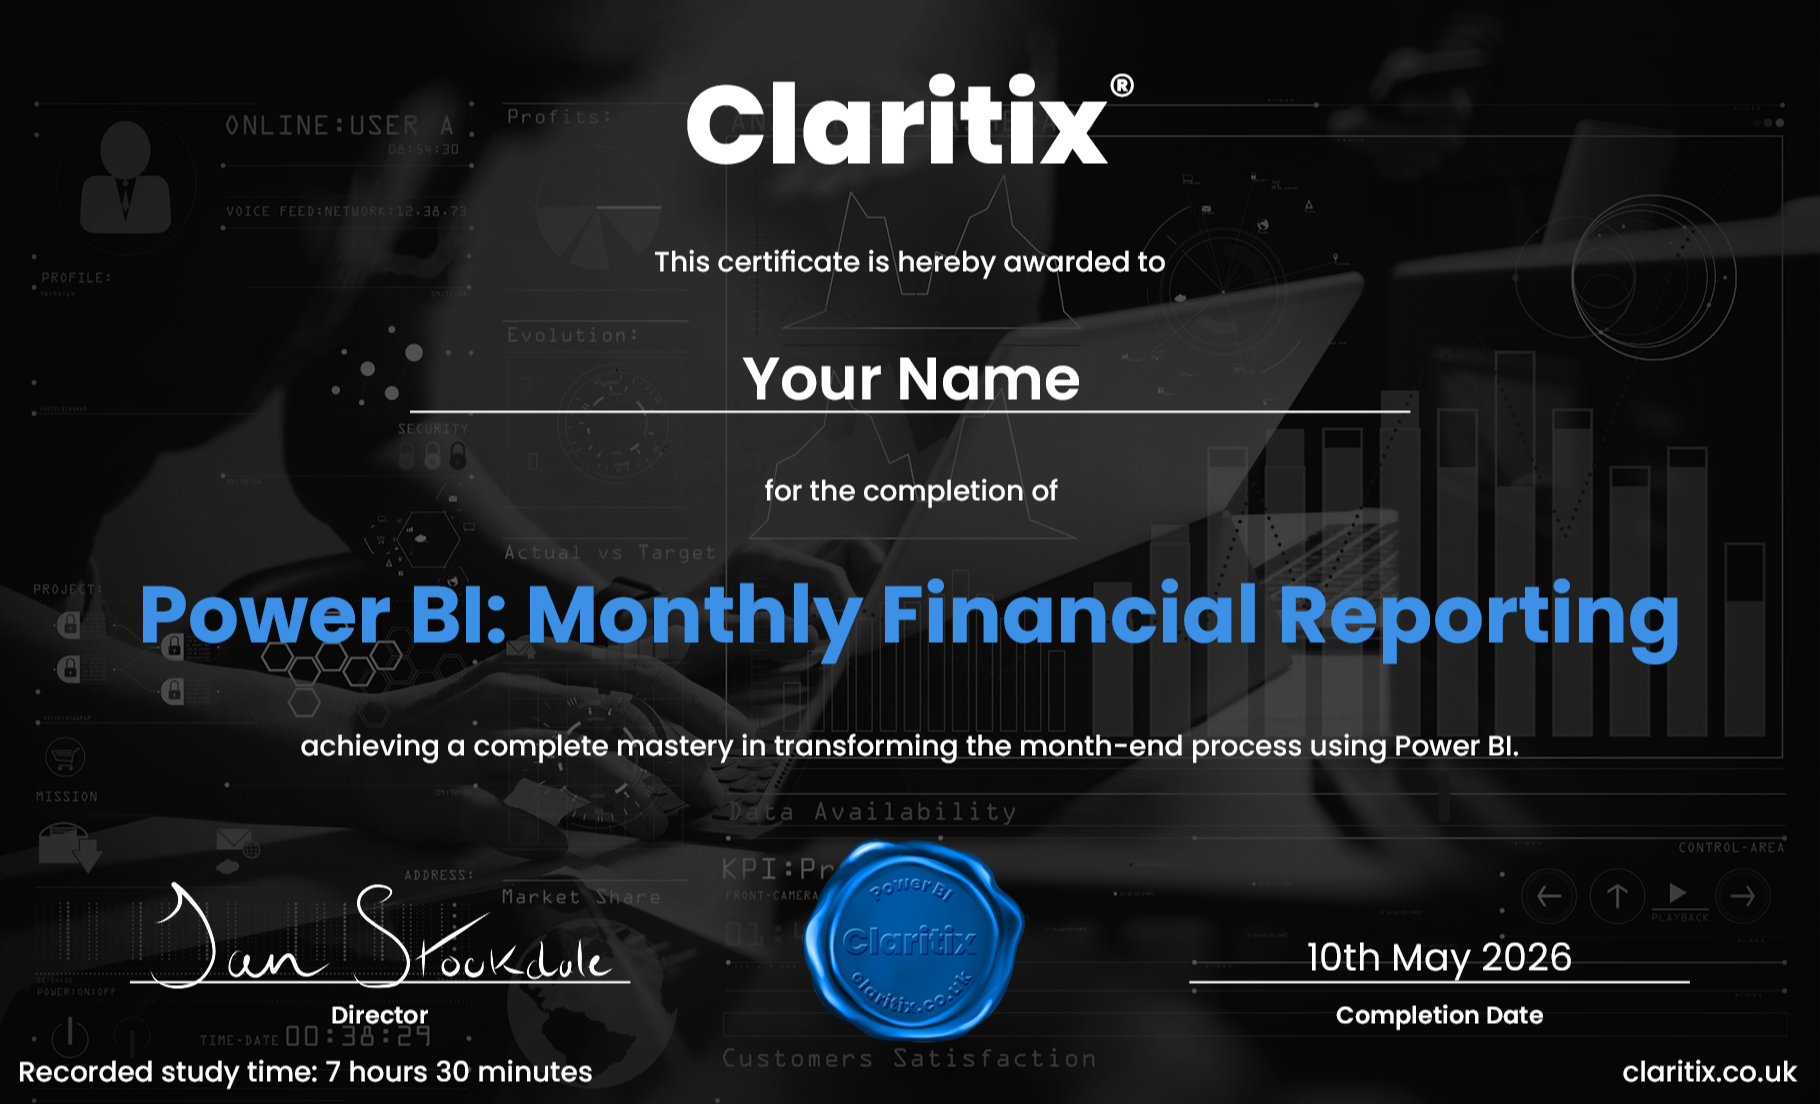
Personalised PDF certificates for CPD records on completion

12-month access
Learn at your own pace – no pressure, no subscription, no auto-renewal
About the course creators
Built by finance professionals, for finance professionals

Dan Stockdale
CIMA-qualified · 15 years in FP&A and financial modelling · Former PwC consultant
Dan built both these courses after years of watching finance teams present the same static reports every month, then rebuild the same numbers by hand the next. The Power Automation Bundle is the pairing he'd have wanted himself starting out: one course that gets the numbers automated in Excel, and one that turns them into dashboards stakeholders can explore without coming back to Finance.

Oliver Deacon
Former Finance Director, Microsoft Seattle · Finance Leadership Coach
The courses have been built in collaboration with Oliver Deacon, who spent several years as a Finance Director at Microsoft in Seattle, where he worked at the cutting edge of leveraging technology and data in financial and commercial reporting.
He experienced firsthand the value generated by using these technologies to redesign processes, raise the quality of output while reducing the time spent doing so, and extract more value and insight from the organisation’s data.
"As a former Microsoft Finance Director, I know how crucial effective month-end reporting to drive action is. We spend so long building manual reports, only for the business to ask us for a different cut or more data – if they even look at them at all!
We built these courses to provide finance teams with everything they need to create insightful and actionable commercial month-end reports."
Oliver Deacon
Former Finance Director, Microsoft
Testimonials
What learners say

"The course provided me with the essential foundations in data structure, mapping, and reporting, enabling me to create impactful dashboards from scratch. It not only saved me time and streamlined processes but also empowered me to deliver innovative solutions that added significant value to our business."
Pieria Protopapa
FP&A Manager, Clear Business

"Dan offers an easy introduction into Power BI whilst in the environment accountants feel most comfortable.
Good pace and expansion into technical areas allows for one to come away ready to apply in your own setting."
Kevin Greenaway
Finance Director, The YES YES Company
"Superb way to learn Power BI! Clearly geared to accountants and the financial reporting process."
Khilan Haria
Head of Strategic Planning, David Lloyd Leisure
Certificate & CPD
Earn two certificates. Support your CPD.
On completion of each course you'll receive a personalised PDF certificate showing your name, the course title, completion date and your recorded study time, designed to support CPD record-keeping.
Whether you are working towards a CIMA, ACCA, ICAEW, or CIPFA CPD commitment, this course provides verifiable evidence of structured learning. A VAT receipt is available following purchase, making it straightforward to expense through your employer’s training budget.
If you're outside the UK, particularly in the US, please check your professional body's specific requirements before relying on this certificate for CPD/CPE purposes. Claritix courses are not currently certified by NASBA.
Free resource
Not ready to enrol yet? Start here for free.
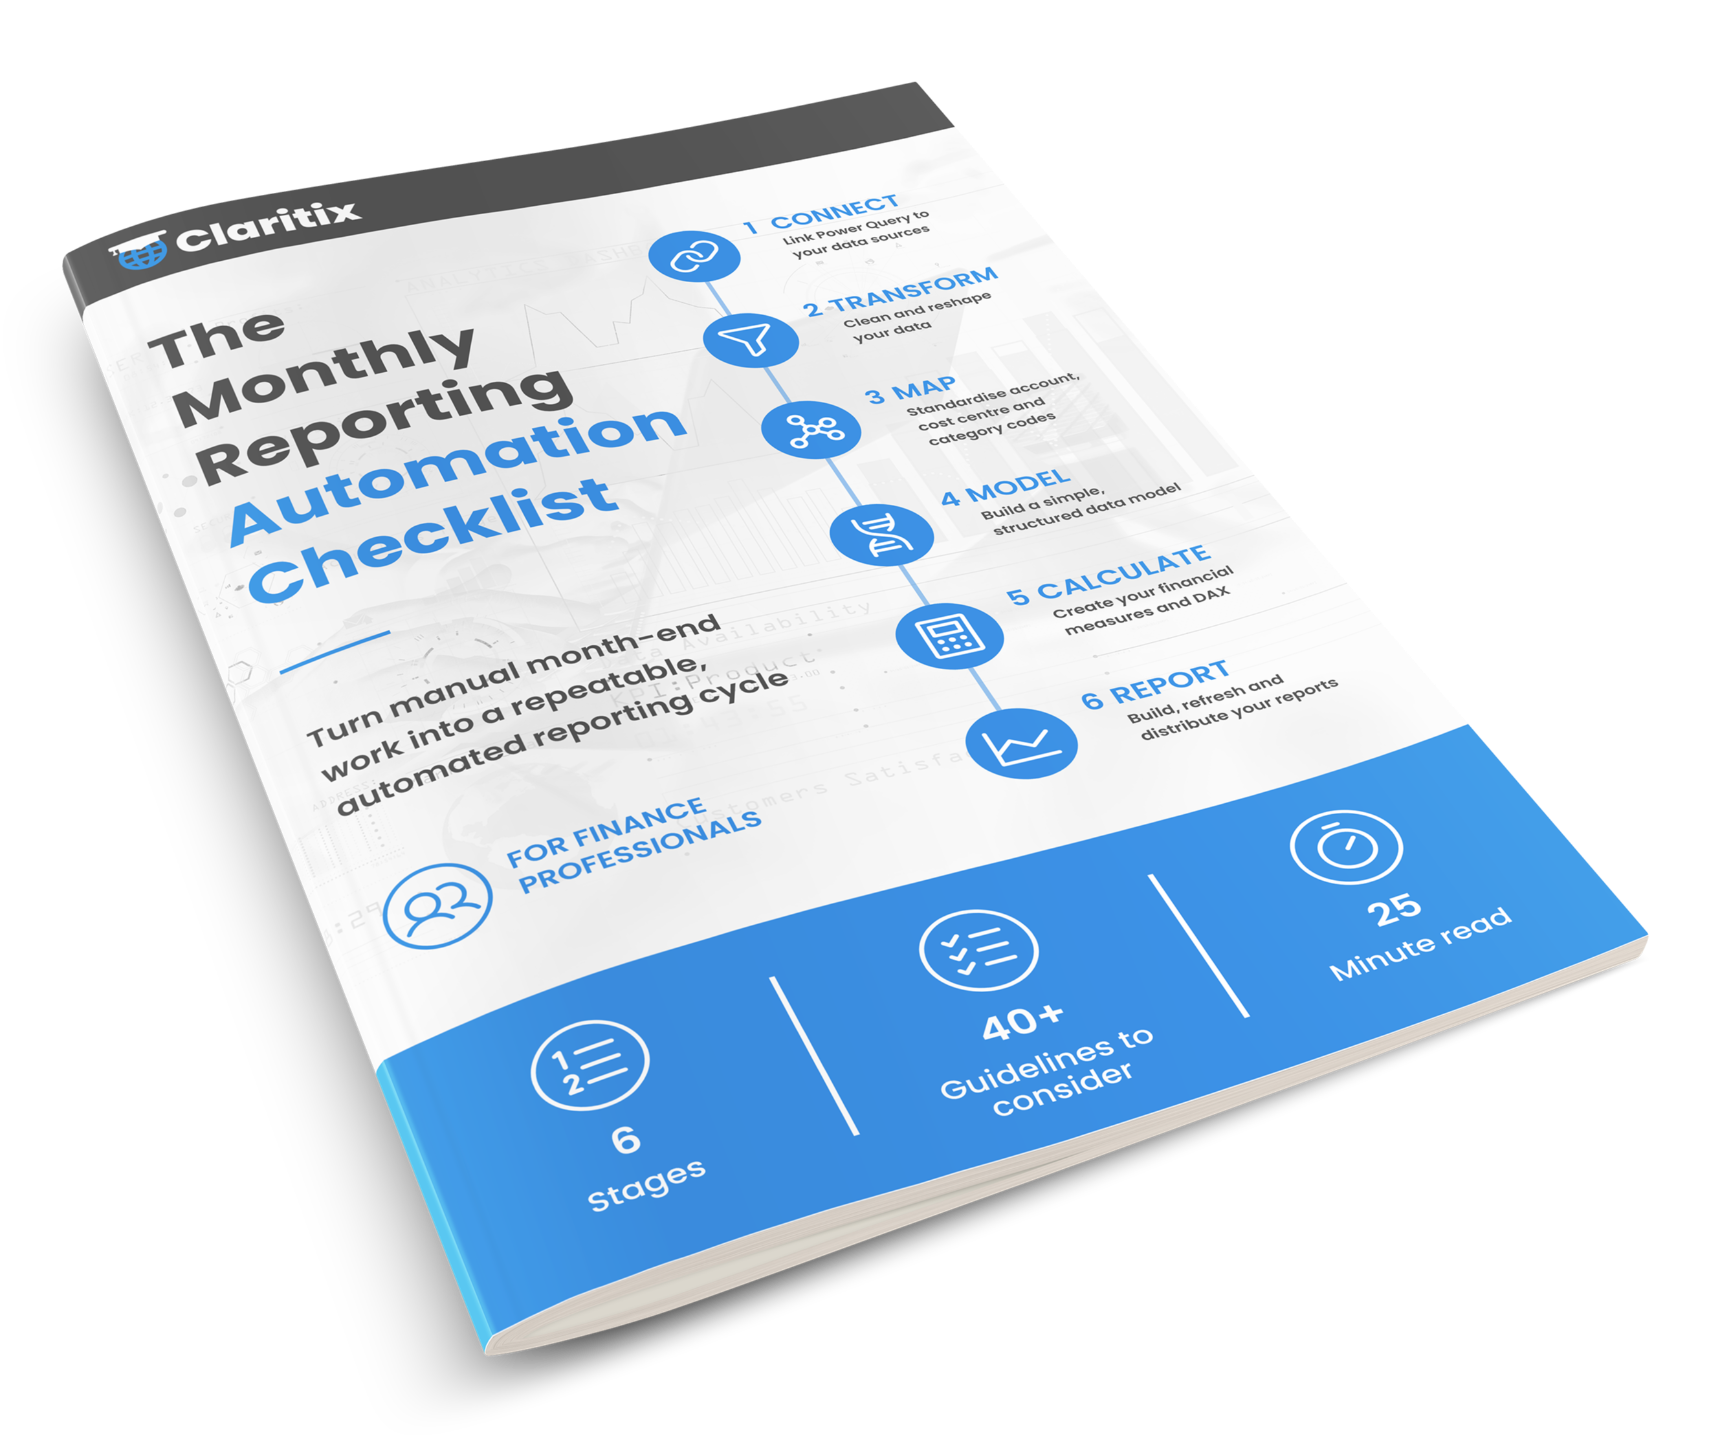
Download the Monthly Reporting Automation Checklist, a free guide covering all six stages of automating your monthly reporting. It maps directly to both courses in this bundle.
Sign up below and we will send it straight to your inbox. No spam. Unsubscribe at any time.
By subscribing you agree to your data being stored and receiving occasional marketing emails.
Pricing
Invest in yourself
12-month access to both courses. Single payment, no subscription, no auto-renewal.
Upgrade to Power Automation Bundle
£465 + VAT
Save up to £125 vs buying separately · 12-month access
Enrol in the Power Automation BundleAlready own one of these two courses? Ask about upgrade pricing and we'll get you the second at the fair bundle-equivalent price, rather than the full individual price.
FAQ
Frequently asked questions
Do I need both courses, or would just one cover what I need?
What's actually different between the two courses if they use the same technology?
Which course should I do first?
Is my Excel or Power BI ability good enough for both courses?
Will this help with genuinely larger or multiple data sources?
If I already own one course, can I add the other at the bundle price?
Will I get one certificate or two?
Is this the same as the Big Data Bundle?
Can I expense this or use it for CPD?
What happens after I buy?
Ready to start?
Ready to automate your reporting, end to end?
Enrol today and get immediate access to both courses, all exercise files, and both slide decks. Learn at your own pace over 12 months.
12-month access · No subscription · CPD certificates included · Immediate access on purchase