Unpivoting Data in Power Query for use in Power BI & Power Pivot
Before working with data in Power BI or Power Pivot, it’s essential to structure your data correctly so the data model and DAX can work with it. This process is carried out in Power Query, and here we look at a common stumbling block – the need to unpivot data.
Incorrectly structured data
Below, we have forecast data for a revenue account code relating to various customers, spread across four columns – Budget and Forecast 1–3.
Let’s assume we have a slicer in a Power BI report to select and return one of these forecasts. A finance professional familiar with Excel formulas may think DAX (the formula language of Power BI and Power Pivot) can simply look up data from a specific forecast column, aggregate it, and return the results – easy!
But this isn’t how data models and DAX work. To extract the data we want from tables, we filter them. To do that here, we first need to restructure the data by unpivoting it.
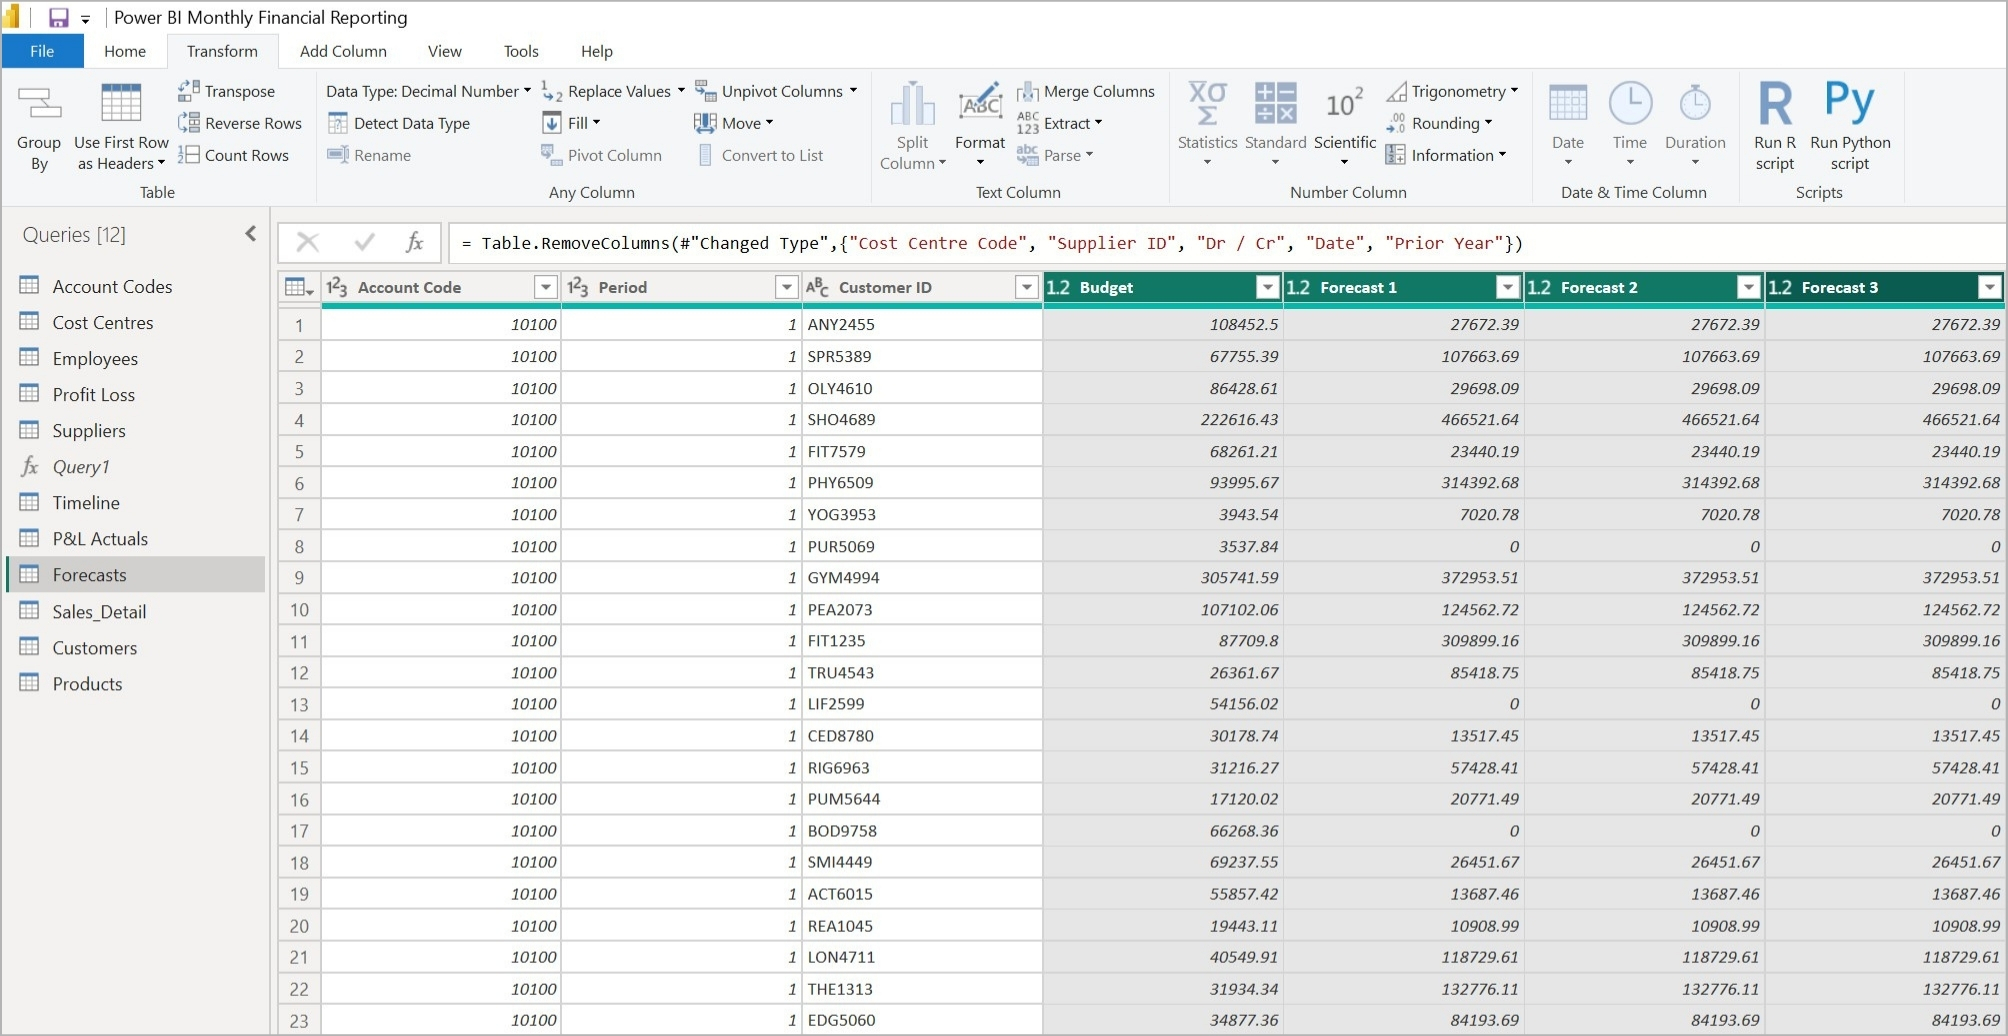
Figure 1: Data in Power Query before unpivoting - forecasts are set across four columns
How to unpivot data
- Select the columns to be unpivoted – click the first column header (Budget), hold Shift, and click the last column header (Forecast 3). Or hold Ctrl and select them individually.
- Go to Transform > Unpivot Columns.
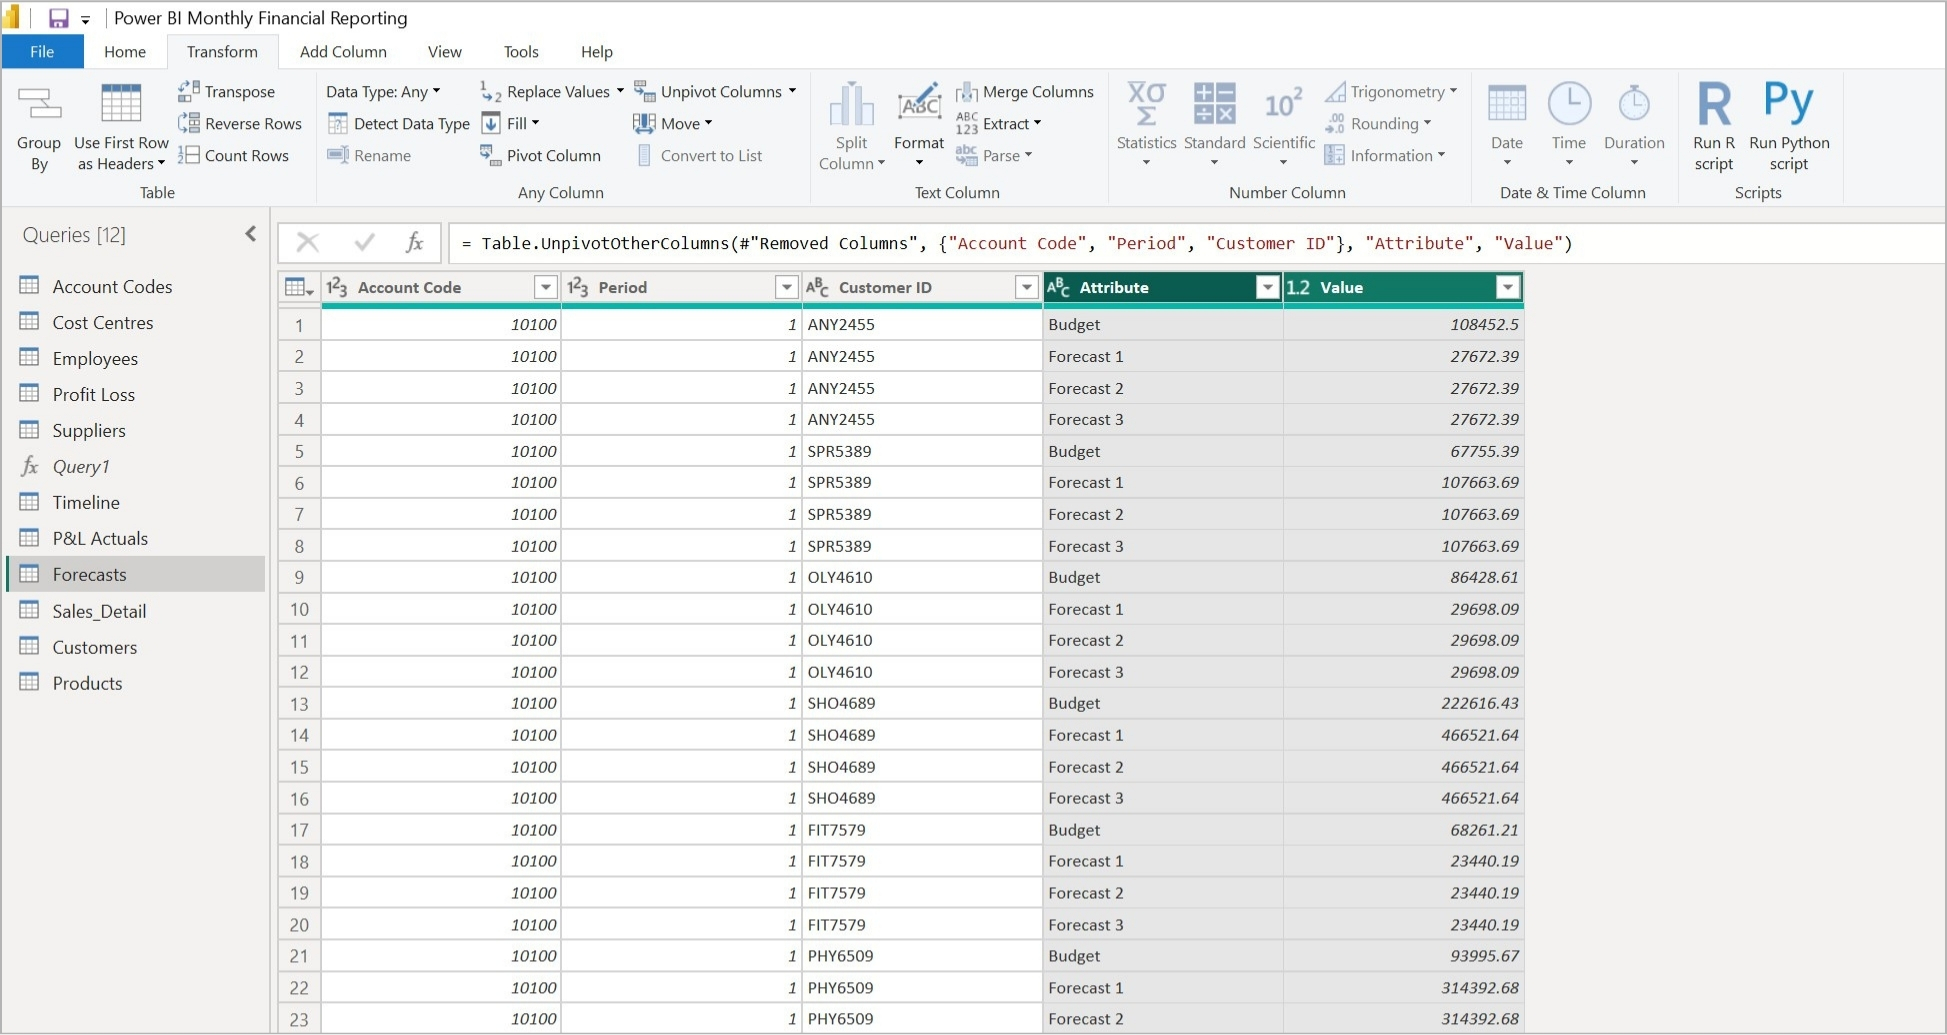
Figure 2: Data in Power Query after unpivoting - forecasts are set across two columns
The result
This transforms the four columns of data into two – see above. One column indicates the budget or forecast type, and the other contains the amount.
Note that the first row of four values in the “before” image now occupies the first four rows in the “after” image, and the Account Code, Period, and Customer ID are each repeated four times. The table of data is now four times longer.
Now, if we select Forecast 1 in the Power BI slicer, the Attribute column will be filtered, and the Value column will contain only Forecast 1 amounts – which DAX can now aggregate.
Our Power Query & Power Pivot: Automating Reporting course and Power BI Monthly Financial Reporting course both cover how to correctly structure data for use in data models and with DAX.