How to Create Measure Tables in Power BI Financial Reports

If you’ve spent any time building financial reporting in Power BI, you’ve probably experienced measure chaos. Measures often end up stored in whichever table was selected when they were created. The result? A cluttered model where key calculations are scattered across multiple tables, making them harder to find, reuse, or troubleshoot.
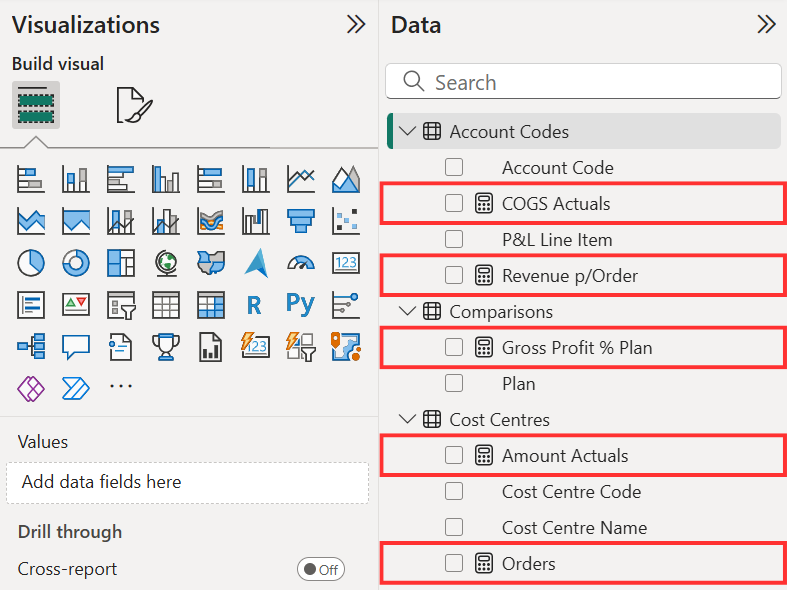
Figure 1: Disorganised measures littered throughout unrelated tables
This may not seem like a big deal when you’re just getting started - but as your report grows, the mess multiplies. And in finance, where consistency and clarity are everything, disorganised models can lead to costly errors, wasted time, and a loss of confidence.
The good news? There’s a simple solution...create Measure Tables!
What is a Measure Table?
A measure table is a placeholder table in Power BI used solely to store your DAX measures. It doesn’t contain any actual data - just the calculations you create to drive your reports.
Instead of being scattered across random tables like Account Codes, Cost Centres, or Forecasts, all your measures are organised in one place. You can even create multiple measure tables for different categories - like one for P&L measures, one for ratios, and another for KPIs.
See Figure 2 for measures neatly organised across four measure tables.
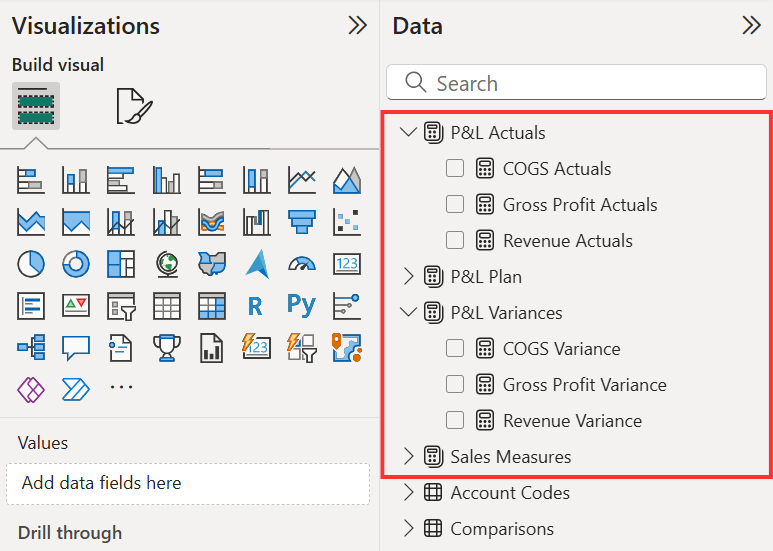
Figure 2: Measures stored and organised into distinct measure tables
Benefits for Finance Professionals
For accountants, analysts, and finance managers, this approach offers several key benefits:
- Faster navigation: No more hunting through tables to find a specific measure.
- Reduced risk of duplication: Prevents you from accidentally recreating the same measure twice.
- More scalable reporting packs: Reports become quicker to build and edit.
- Cleaner models: Your model is easier to audit and explain to others, and inspires confidence.
** If you like this insight, download a copy of our FREE Power BI Tips & Advice eBook **
How to Create a Measure Table in Power BI
1. Create a Blank Table
Go to Home > Enter Data. This allows you to manually create a new table. Give it a clear name that relates to the measures it will house - like P&L Actuals - and click Load. Note: We leave the default Column1 blank - see Figure 3.
** Prefer a video? Watch our video Create Measure Tables in Power BI **
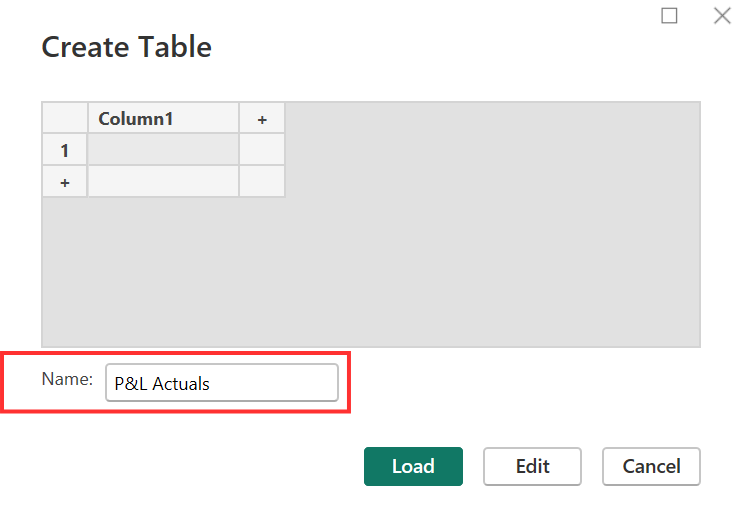
Figure 3: Create a blank table with an appropriate name
A new table is created containing the single blank column. At this point it’s just a regular table and is sorted alphabetically with the other existing tables of data.
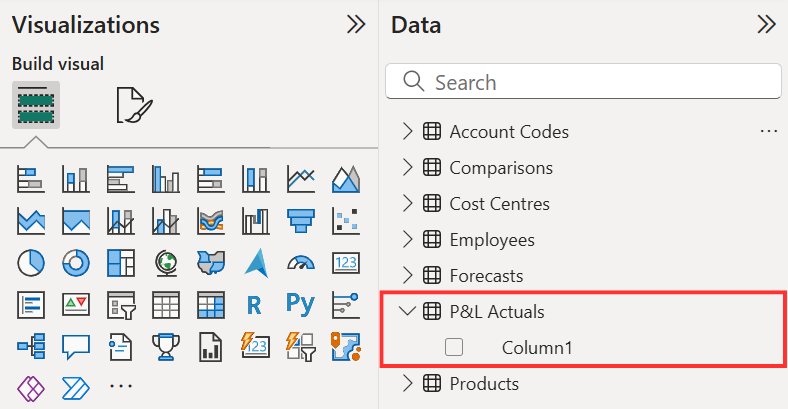
Figure 4: Regular table with a single blank column
2. Relocate a Measure
To move a measure to this table, select it, then go to Measure Tools > Home Table and assign it to your new table using the drop-down. In Figure 5 we are moving the COGS Actuals measure from the Account Codes table to the new P&L Actuals table.
Note: Unfortunately, you can’t drag-and-drop measures between tables. You’ll need to reassign each one manually.
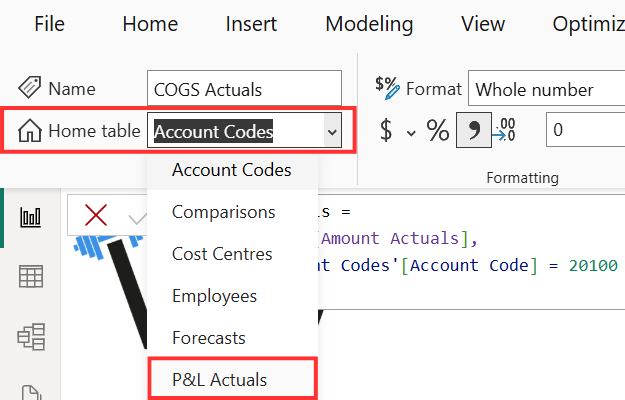
Figure 5: Move measures using the Home Table drop-down
3. Delete the Blank Column
Right-click Column1 in your measure table and choose Delete from model – see Figure 6.
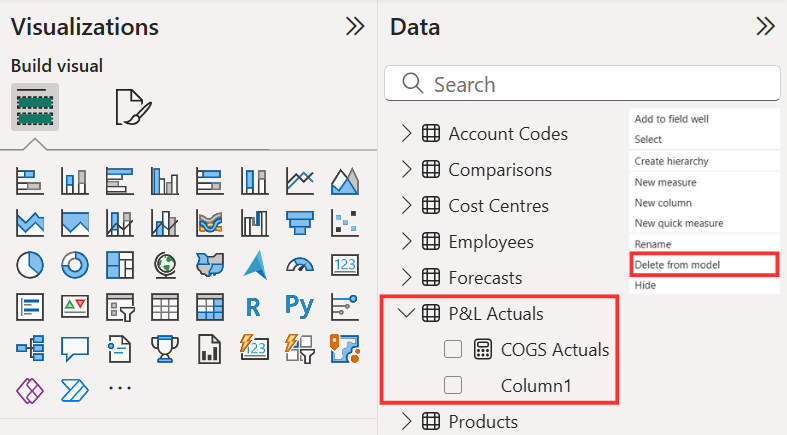
Figure 6: Regular table containing a measure and a blank column
Once a table contains only measures and no blank columns, it changes to a measure table, the table icon changes to a calculator icon with a shadow, and it moves to the top of the Data Pane – see Figure 7.
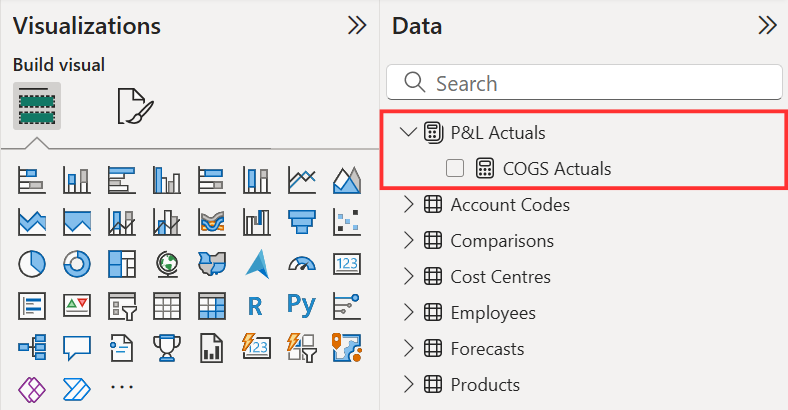
Figure 7: Measure table containing only measure located at top of Data pane
Repeat the above steps to create more measure tables and to file away all your measures in them. The end result should look like Figure 2.
4. Stay Organised
Going forwards, when you create new measures first select the measure table that it should live in – this will save you having to relocate it. And adopt a consistent and concise naming convention for both the measure tables and the measures – Actuals, Plan, and Variance distinguish between the different measures in Figure 2.
Final Thoughts
As your financial reporting processes become more complex, the way you organise your Power BI models can make a huge difference. A simple measure table may not seem like a game-changer, but for finance professionals dealing with monthly reporting, performance analysis, and audit reviews, it’s a smart, time-saving habit worth adopting.
Looking to level up your Power BI skills? Explore our Power BI Monthly Financial Reporting course, designed specifically for finance and accounting teams.