5 Power BI Financial Reporting Optimisations and their Benefits

Power BI is Microsoft’s data visualisation tool, designed to connect to data from multiple sources (via Power Query) and transform it into engaging, dynamic and interactive dashboards.
Consistently rated by Gartner as the leading business intelligence platform, it’s available to most Microsoft Office users - making it a highly valuable and transferable skill to develop.
Below, we explore five practical ways Power BI can transform financial reporting and the benefits each brings.
Automate data cleaning and mapping with Power Query and data models
The first step in Power BI is using Power Query to content to, extract, and clean data before loading it into Power BI as tables. Relationships can then be added between common fields in the tables to produce a data model that maps attributes of the data.
- Save time: Gathering, cleaning and mapping data typically involves performing the same manual processes every time the data updates – removing columns, filling gaps, updating mapping tables and formulas. This repetition can be automated. Transformations made in the Power Query Editor are recorded as Applied Steps. Data models map data without the need for formulas. Design your process once and then just hit Refresh.
- Reduce risk with robust process: Automation removes human error – copy-paste mistakes are eliminated and transformations are applied consistently. Because data models don’t involve formulas, risks such as not referencing new data when updating mapping formulas – like you might when mapping data in a spreadsheet – are removed.
- Maintain an audit trail: Manually cleaning and shaping data often leaves no record of the changes made, creating uncertainty around the veracity of the data. In the Power Query Editor, every transformation is logged in the Applied Steps pane, allowing users to review and trace the process end-to-end.
** Start transforming your Power BI skills with our FREE Power BI Tips & Advice eBook **
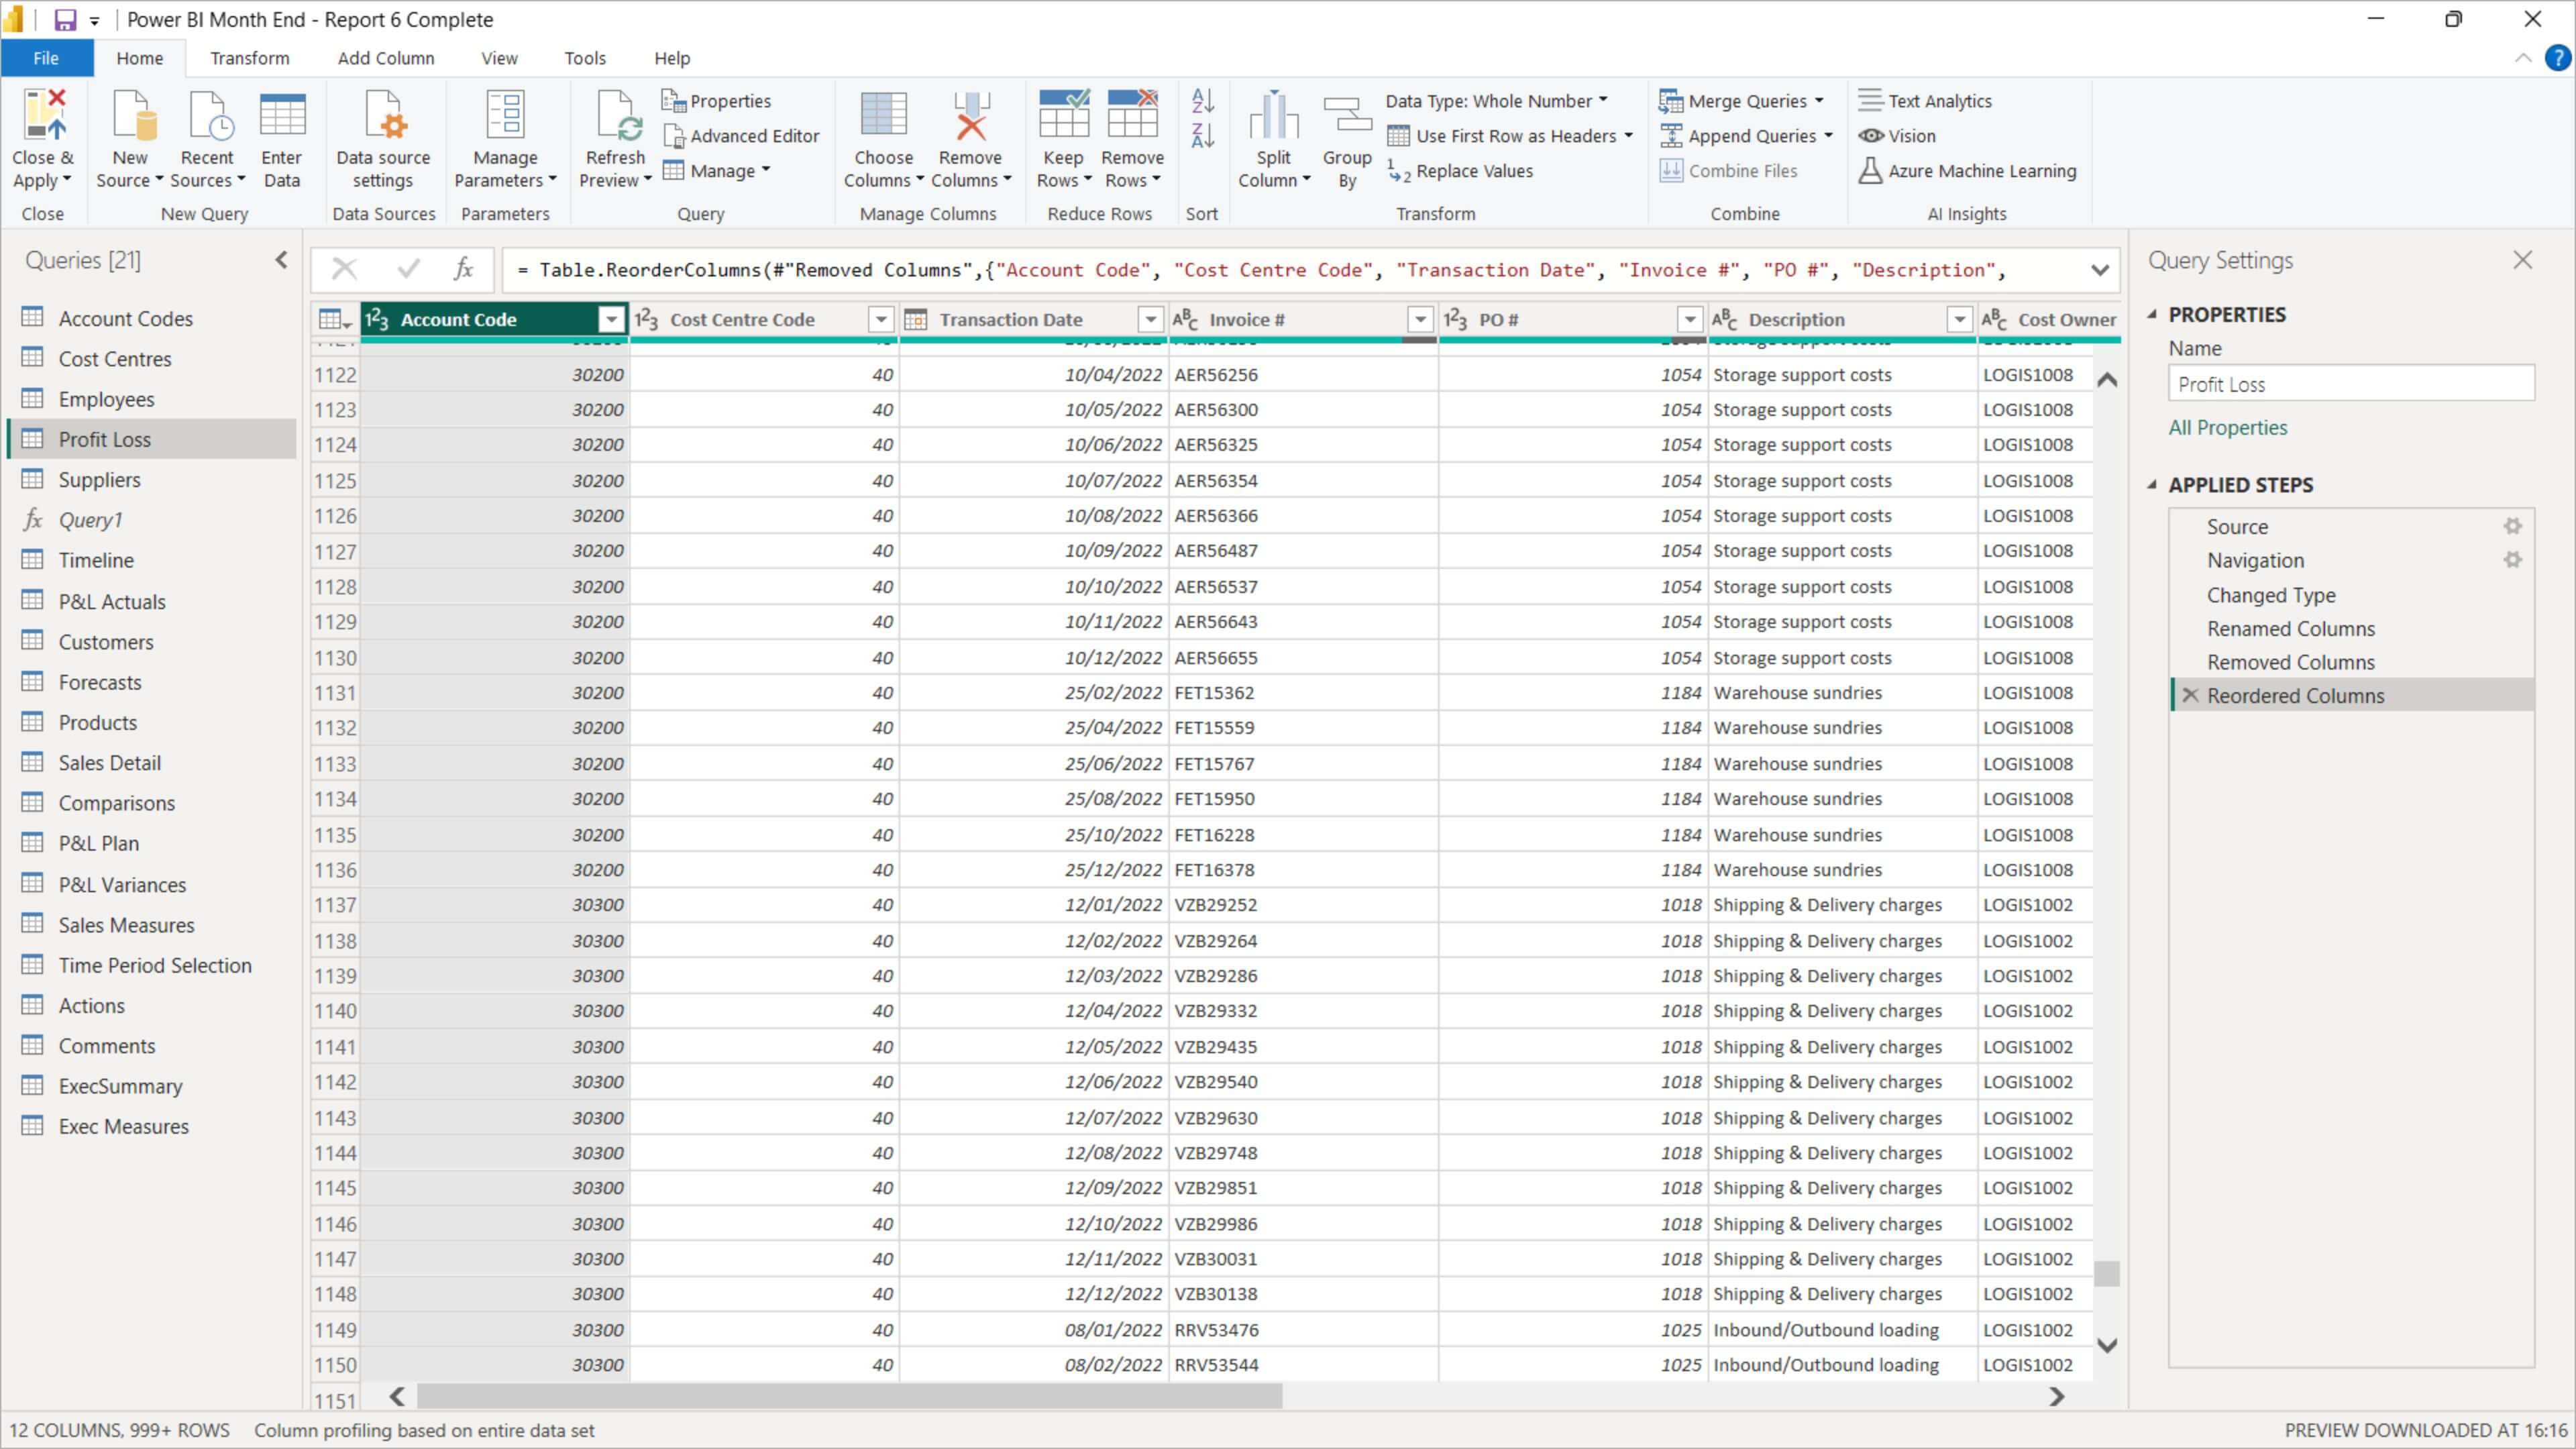
Power Query Editor with recorded transformations in the Applied Steps pane (on right)
Distribute reporting via Power BI Service (the Cloud)
Once created, reports can be published to Power BI Service (app.powerbi.com) for distribution across the organisation. Recipients can open, view, and interact with them directly in their browser.
- Save time: Reports are published to workspaces – shared folders that authorised users can access – and recipients receive a notification. Time is saved when compared to the traditional process of composing an email, saving and attaching files, adding recipients, and sending.
- Increased data security: Whilst the data model and data get published along with reports, access rights can restrict their viewing or download and data can be removed by the owner at any time. This is more secure than emailing out reports and losing control of sensitive data.
- Reduced duplication and confusion: Where multiple iterations of a monthly reporting pack are emailed out, there’s the tendency to lose track of the latest version. With cloud distribution, updates overwrite the published version so everyone always sees the most up-to-date numbers.
** The reports below are taken from our Power BI Monthly Financial Reporting course. **

Power BI financial report displayed in a browser after being published to Power BI Service
Answer audience questions in real-time to reduce follow-up work
With Power BI, you can respond to audience questions on the spot by interacting with live reports. Instead of deferring queries, you can drill into the data together and agree answers in real time.
- Save time: Addressing questions immediately removes the need for follow-up analysis and extra report preparation, which may still leave gaps or trigger further requests.
- Improved quality of information: Turning a presentation into a two-way conversation helps your audience focus on what matters most to them and extract the insights most relevant to their needs.
Move towards self-service reporting
Power BI makes it possible to share interactive dashboards where users can explore the data themselves. Instead of relying on finance to prepare and walk through every report, stakeholders can drill into the numbers, apply filters, and find the information most relevant to them at their own pace.
- Save time: Traditional financial reporting often means booking time with stakeholders each month to walk through the numbers. With self-service dashboards, much of this can be avoided – stakeholders can find answers directly, reducing scheduling, preparation and presentation time.
- Offer greater flexibility: Stakeholders can review reports when it best suits them and drill into the areas most relevant to their role, rather than waiting for a scheduled presentation.
Generate commercial insights to add value
Power BI can process large datasets, perform powerful calculations, and present results visually – making it far easier to identify trends and uncover meaningful insights in organisational data.
- Deliver high-value insights: Finance teams can move beyond just reporting actuals versus forecast to providing actionable commercial analysis that explains performance and helps drive positive change.

Power BI profitability analysis report used to gain insight on brand and product performance
Conclusion & How to Learn More
Power BI offers organisations a solution to faster, more reliable, higher-value reporting and finance professionals an opportunity to free up time and become a more influential business partners.
Learn to automate data preparation, streamline distribution, enable interactive discussions, move to self-service reporting, and uncover commercial insights with our course Power BI Monthly Financial Reporting.