How Finance Teams can Analyse Big Data in Excel PivotTables using Power Query

When we think of “big data,” Excel likely isn’t the first tool that comes to mind. It’s often seen as suited to smaller-scale analysis - and with good reason. Excel worksheets max out at just over a million rows, and anyone who’s worked with large datasets has faced slow performance, crashes, and the frustration of watching calculations crawl to 100%.
But Excel has evolved. With built-in tools like Power Query, Power Pivot, and the new Python integration, it’s now possible to automate financial reporting and build advanced analytics, detailed financial statements, and responsive dashboards - all powered by millions of rows of data.
It all begins with Power Query - an ETL (Extract, Transform, Load) tool ideal for importing and cleaning financial data in Excel and Power BI, and preparing it for analysis. It lets users connect to ~40 data sources from Excel (or ~200 from Power BI), apply recorded transformations to clean the data, and load it into Excel in various ways.
Before getting into a step-by-step of how we can involve PivotTables in this process, let’s take a step back and consider why this approach is worth using.
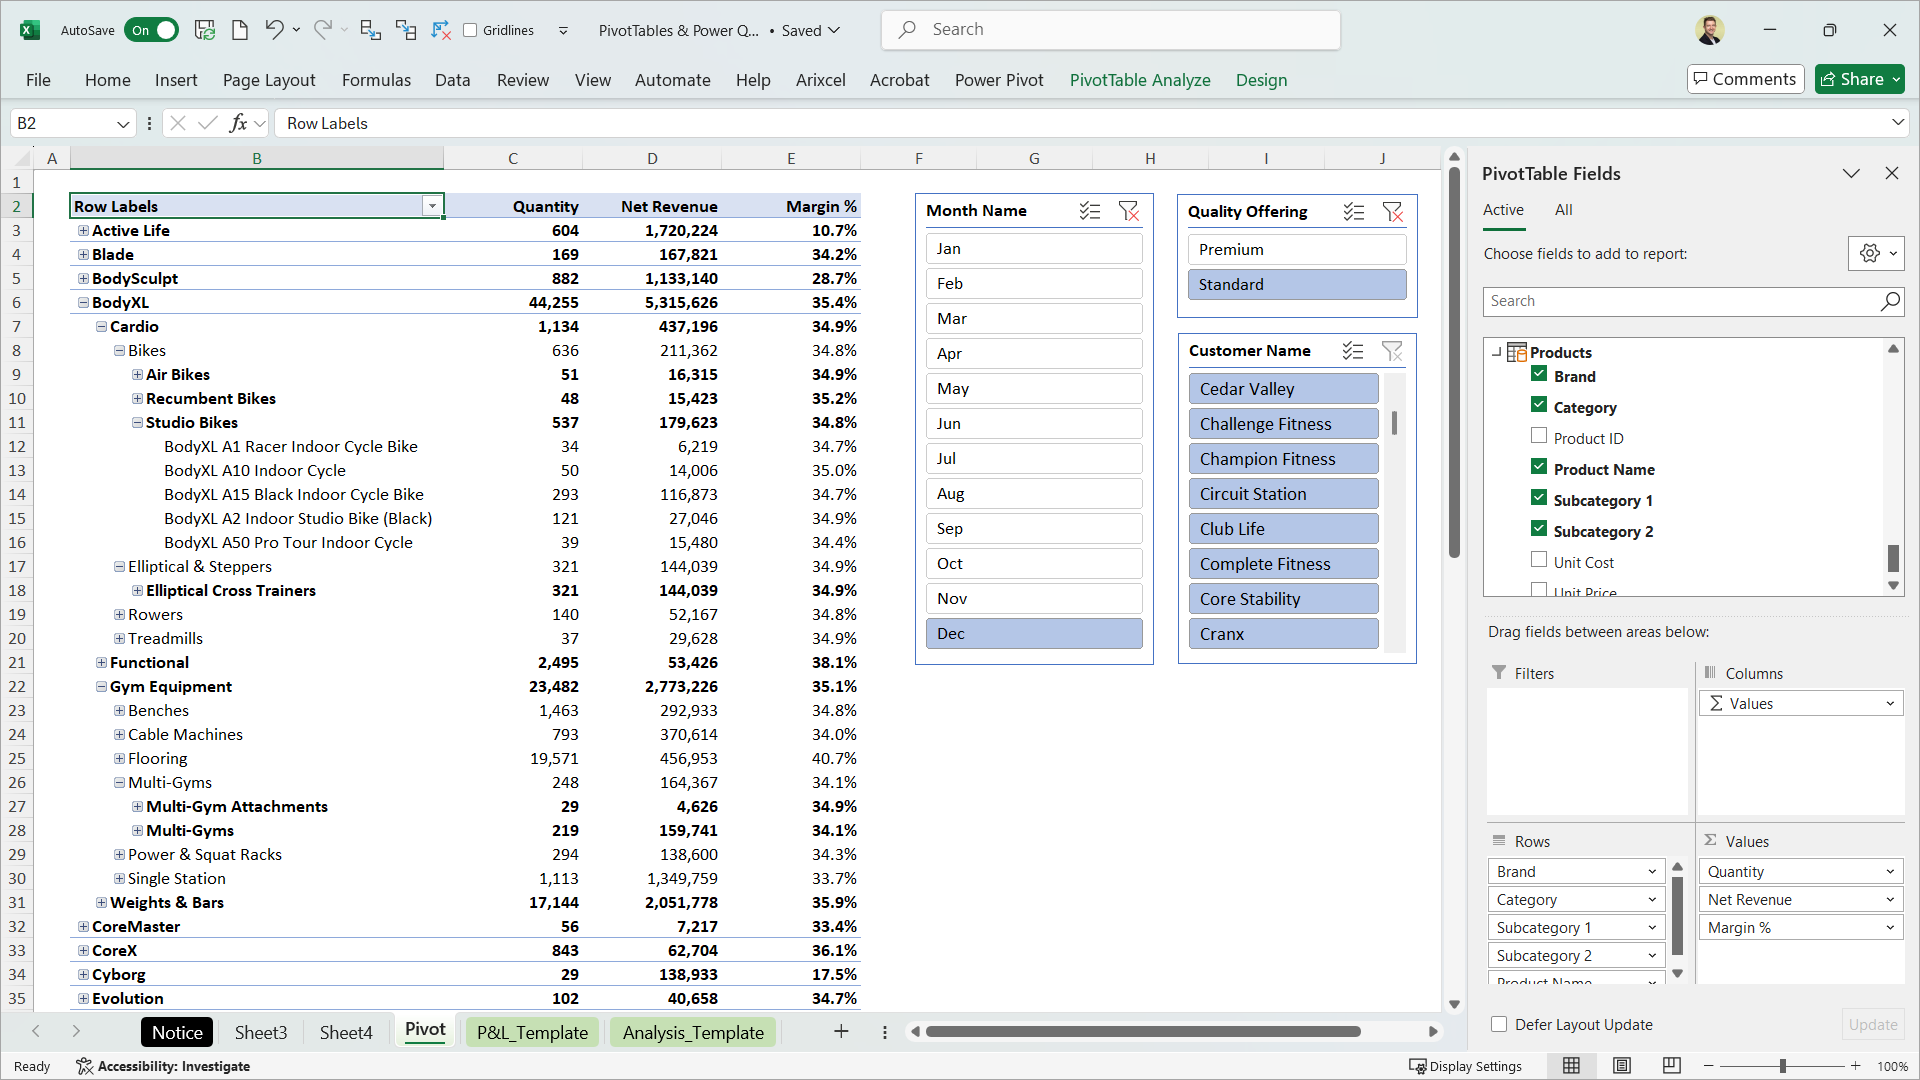
Figure 1: PivotTable in Excel created from data loaded with Power Query
PivotTables provide a user-friendly interface to view financial data
Needing to drill into 200,000 rows of transactional records, journals, or product-level sales, such as during month-end close, variance analysis, or management accounts preparation, isn’t an uncommon requirement for finance professionals. But doing this in Excel - by pasting in the data and filtering - is often slow, frustrating, or simply not possible with large datasets.
So why not just use the source system to summarise or drill into the data? The reality is that while many systems store data efficiently, their reporting tools are either non-existent, limited, or require advanced technical skills.
For example, data in an SQL server may need SQL queries to extract useful summaries. Most finance professionals don’t write SQL, and even those who do may find it too slow to build, test, and tweak code - especially during month-end or whilst under pressure from a CFO - making SQL vs Excel Power Query a practical discussion for many finance teams.
PivotTables, by contrast, are quick to set up, flexible, and familiar. They let finance professionals slice, filter, and aggregate data intuitively - with no coding required.
Data can be cleaned in the process
If there are issues with the source data - such as errors, gaps, or inconsistencies - there’s often no functionality to fix these, or it at least requires making permanent changes.
Power Query allows you to insert an automated, repeatable data-cleansing stage before the data reaches your PivotTable. Using its user-friendly editor, you can clean and shape the data without altering the original source - ideal for quick analysis. And when the data updates, simply click Refresh to re-run the process.
** If you’ve wondered ‘What’s the best way to clean financial data in Excel?’, check out our article Automate Data Cleaning in Financial Reporting with Power Query **
Map multiple data sets and add calculations
Bringing Power Pivot into the mix takes things further - allowing you to import and map data from multiple sources and add DAX calculations, such as profit margin measures or budget vs actuals KPI calculations - all feeding into your final PivotTable. This enables richer analysis and greater use of your organisation’s data.
The next section keeps things simple, using a single data source and no calculations, but we’ve included a link at the end to take things further.
** To learn more about how Data Models can add efficiencies and reduce risk in reporting, read our article Automate Mapping in Financial Reporting with Data Models **

Figure 2: Power Query Editor interface in Excel
How to Use Power Query & PivotTables in Excel: Step by Step for Finance Pros
1. Launch Power Query Editor
In Excel, go to Data > Get Data > Launch Power Query Editor. This is your workspace for connecting to data sources, transforming data, and preparing it for Excel.
2. Connect to Your Data
Click Home > New Source, choose your data source (e.g. SQL Server), enter the connection details or browse to your file, and select the data to import.
3. Transform and Clean the Data
If any data cleaning is required, now’s your chance. Apply data transformations - such as removing columns, filtering blanks, or replacing values. Each step is recorded and reapplied on refresh, so no more monthly manual cleanup.
4. Load the Data as a PivotTable
Click Home > Close & Load To..., then select PivotTable Report in the Import Data dialog. This creates a blank PivotTable linked to your Power Query result - and without loading data into a worksheet, unlike traditional PivotTables.
If your dataset is large (e.g. over 100,000 rows), performance may lag. To optimise it, also tick Add this data to the Data Model. This loads the data into Power Pivot, storing it in a compressed format and using the VertiPaq engine (also used in Power BI) for fast processing of millions of rows. These Excel Data Model performance tips ensure smooth analysis and the level of responsiveness you are accustomed to when using PivotTables.
The result: A blank, high-performance PivotTable ready for slicing, filtering, and analysis - even on massive datasets.
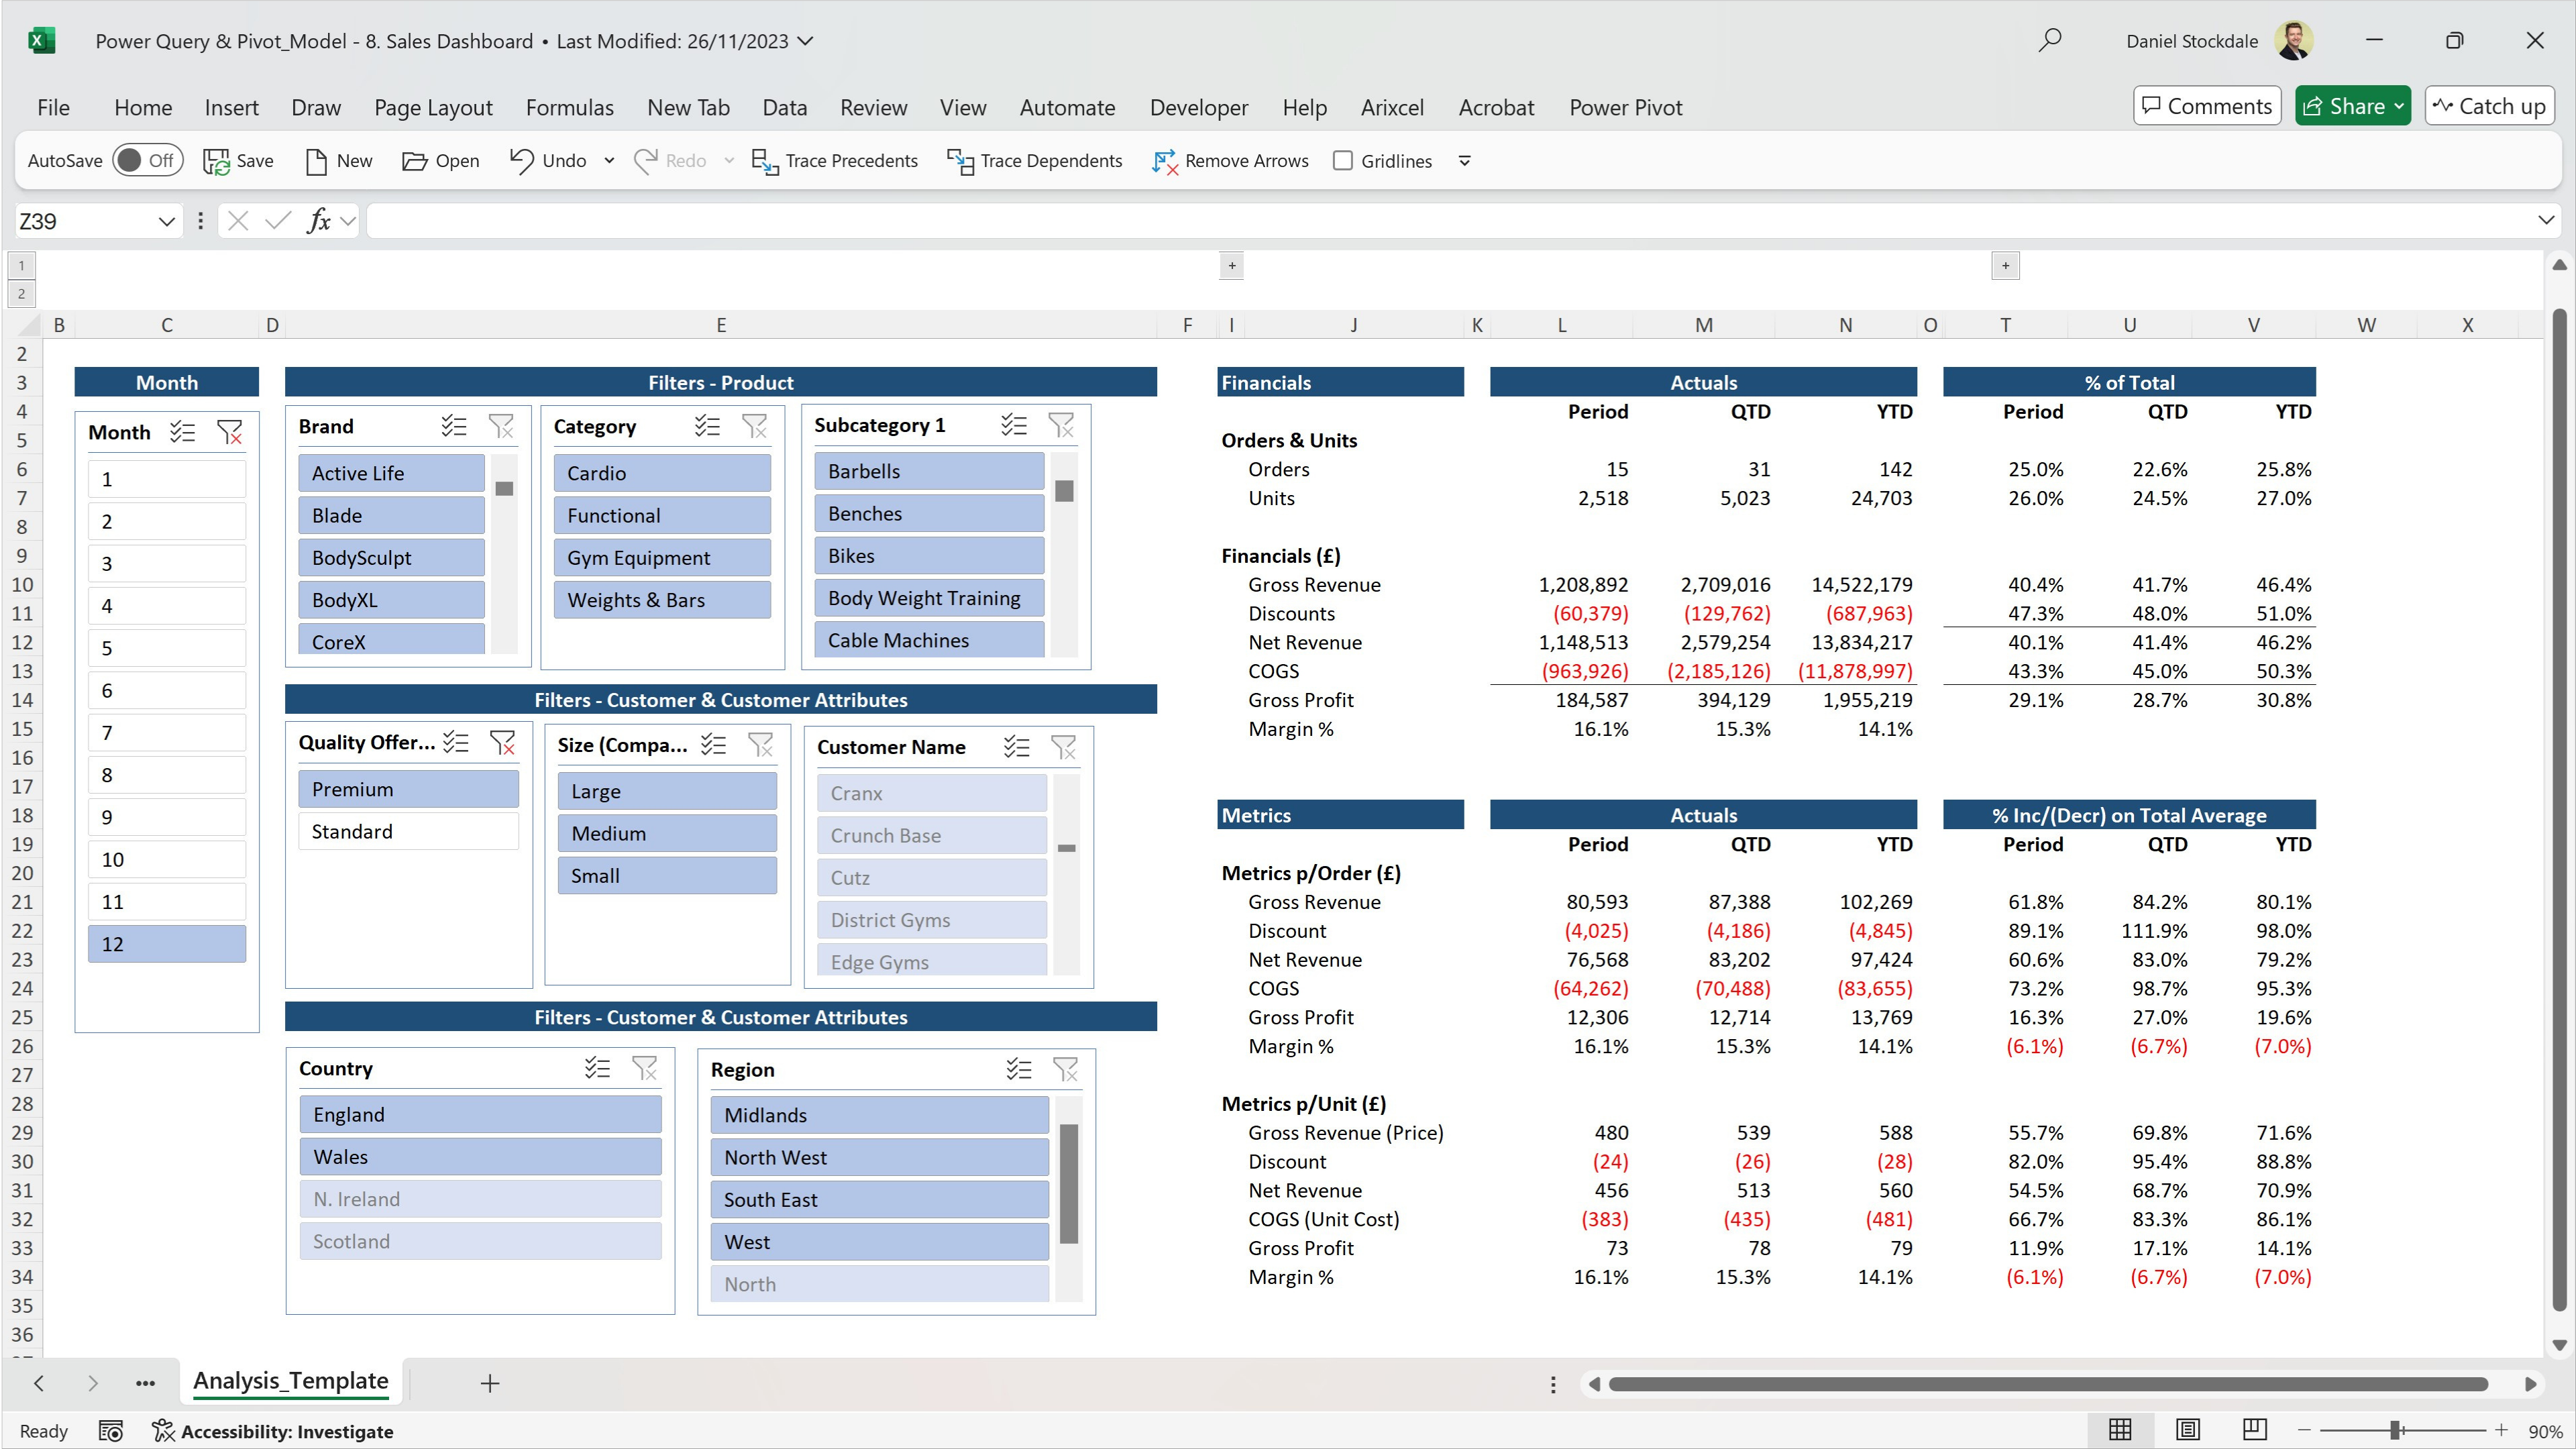
Figure 3: Sales dashboard taken from Power Query & Power Pivot: Automating Reporting course
Get our Power Query & Power Pivot course for finance professionals to automate financial reporting in Excel
Using Excel for big data might seem contradictory, but with Power Query and Power Pivot behind the scenes, it becomes a powerful tool for large-scale, repeatable reporting.
Looking to learn more? Visit our Power Query & Power Pivot course page - learn how to connect to, map, and calculate multiple large datasets to enhance PivotTables and build filterable financial statements and dashboards.