How to Use Arixcel to Navigate a Financial Model
Introduction
Arixcel is a superb and cost-effective Excel add-in, predominantly used to navigate financial models and spreadsheets. It is used by top banks, consultancies, and professional services firms. We were introduced to it whilst working within a dedicated modelling team in PwC London, where its use was compulsory due to its time-saving benefits. We advocate its use with all our clients.
Functionalities
Arixcel’s functionality is split into three distinct areas:
- Navigation – Explore Precedents and Explore Dependents to rapidly move around a spreadsheet and understand formulas.
- Audit & Analysis tools – Formula Map, Calculation Flow, and Comparison to analyse the consistency of worksheet formulas and structure, and identify the purpose of cells.
- Utility Shortcuts – Leverage and customise a range of time-saving shortcuts (e.g. unhide all worksheets).
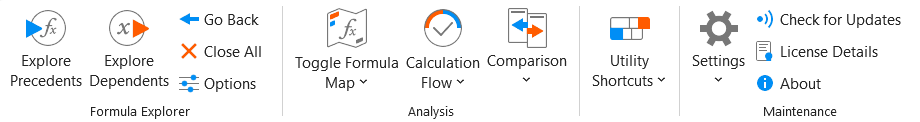
Figure 1: Arixcel tab of the Excel Ribbon
Navigation – Explore Precedents and Explore Dependents
The focus of this article is on its navigational functionality – Arixcel Explorer - which is by far its most significant use and historically where the add-in started before expanding into the above two areas.
Explore Precedents, specifically, is the focus, as this accounts for the majority of Arixcel Explorer’s use. By learning this, the Explore Dependents functionality – which is briefly covered at the end - becomes intuitive.
Shortcuts
Once Arixcel is installed and present in the Excel Ribbon, the following shortcuts launch Arixcel Explorer:
Ctrl + Q – Explore Precedents
Ctrl + Shift + Q – Explore Dependents
The following shortcuts close Arixcel Explorer:
Enter – the active cell(s) remain selected.
Esc – the active cell(s) revert to those selected in the remaining active Arixcel Explorer if multiple Arixcel Explorers windows are in use – explained later in article.
Other useful shortcuts:
Ctrl + Backspace – when used once all Arixcel Explorer windows are closed, returns to the original selected cell of the first Arixcel Explorer.
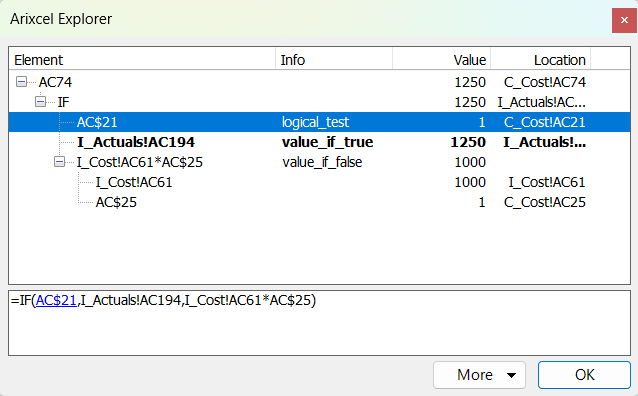
Figure 2: Arixcel Explorer window
Overview of Demo Model’s Structure
To demonstrate Arixcel Explorer’s use, we give a worked example in a financial model. It is worth briefly familiarising yourself with the model’s structure. The Model Map in Figure 3 shows a series of yellow input worksheets feeding into green calculation worksheets, which are summarised in blue output worksheets.
We can see these worksheet tabs at the bottom of image.
Note: the Consol worksheet consolidates P&Ls in worksheets 1 to 4 and Central - each representing a business unit and central costs. The Consol worksheet’s precedents are therefore in worksheets 1 to 4 and Central, whose precedents are in turn in the green worksheets etc.
👉 Prefer a video? Watch our Arixcel demo video
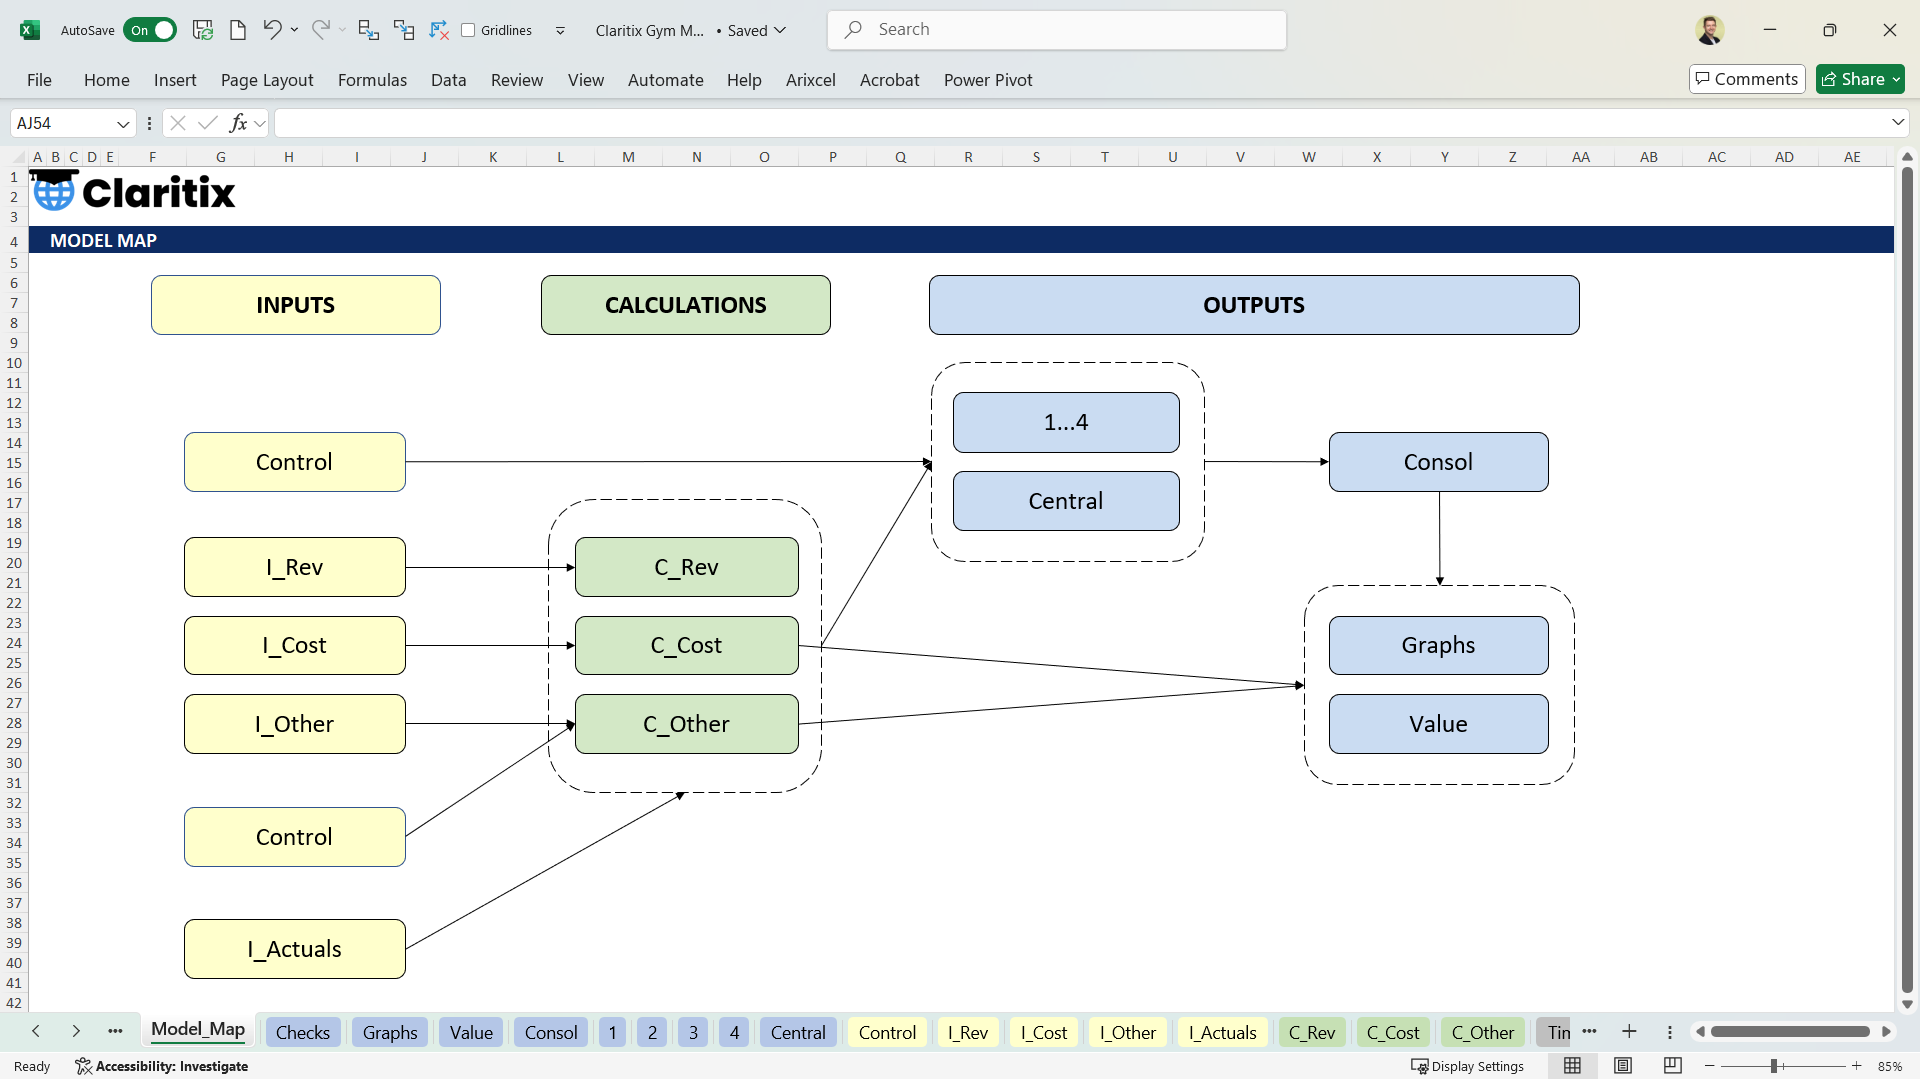
Figure 3: Model Map showing flow of data of model used to demonstrate Arixcel
Explore Precedents to establish assumptions making up outputs
Typically, we want to navigate through the model backwards - tracing precedents. We start at the blue output worksheets, such as a P&L, and drill through to calculations, and then to inputs. In doing so, we can ultimately establish the assumptions that make up our P&L numbers.
Initial drillthrough
In this worked example, we begin in our consolidated P&L and want to investigate the figure of 282,048 in Consol!BT30 – see Figure 4.
We select cell BT30 (which therefore becomes the active cell) and then press Ctrl + Q to open Arixcel Explorer. Alternatively, we can click Explore Precedents in the Arixcel tab of the Ribbon.
The active cell is shown in the first row of Arixcel Explorer and highlighted in blue. The remaining rows relate to the components of the cell’s formula – in this case, just a SUM function.
👉 Learn best practice modelling techniques used in the Big 4 with our Excel Modeller course
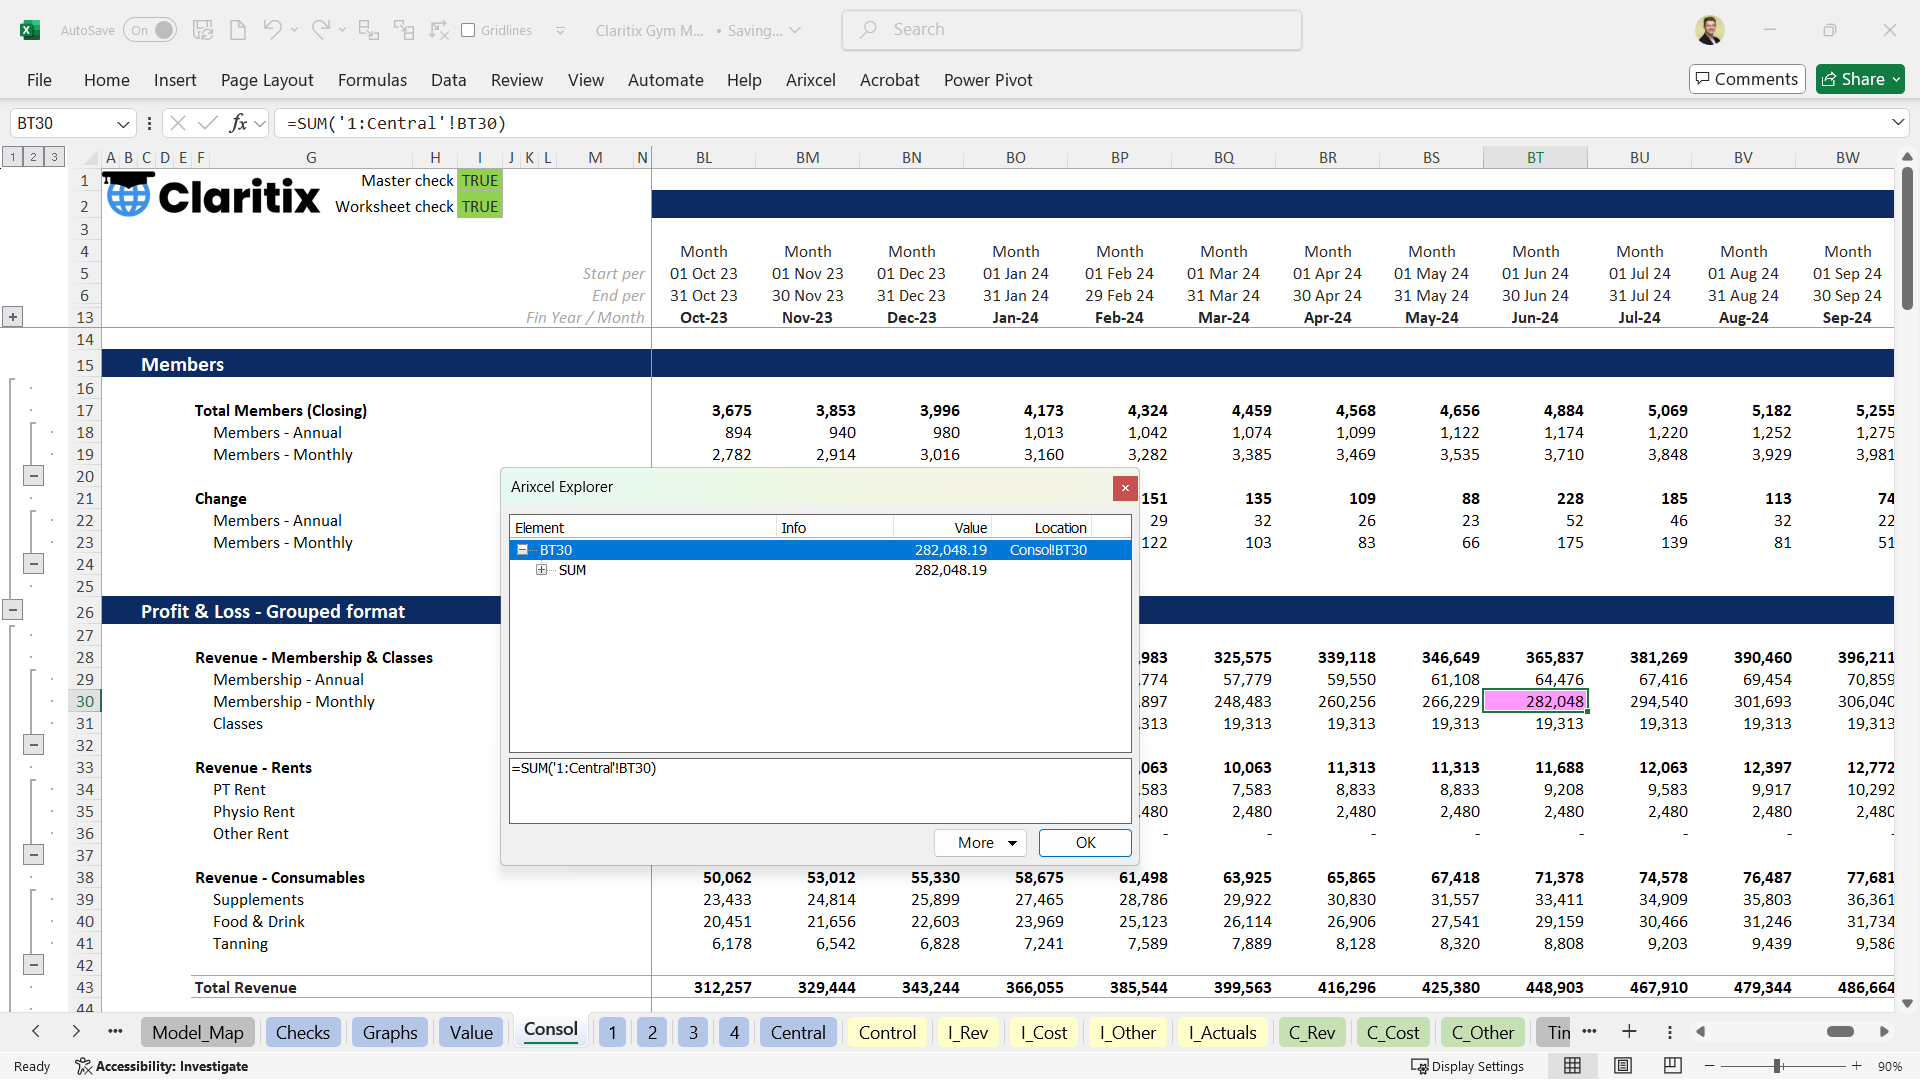
Figure 4: Initial view when launching Arixcel Explorer on cell BT30 of the Consol worksheet
We can navigate Arixcel Explorer with the keyboard arrow keys. Navigating down selects the SUM function component. Note in Figure 4 the ‘+’ symbol next to SUM – this can be expanded with the right arrow key and then collapsed with the left arrow key.
Expanding it reveals the parameters of the SUM function – see Figure 5. This SUM function is performing a 3D reference – summing cell BT30 across five worksheets.
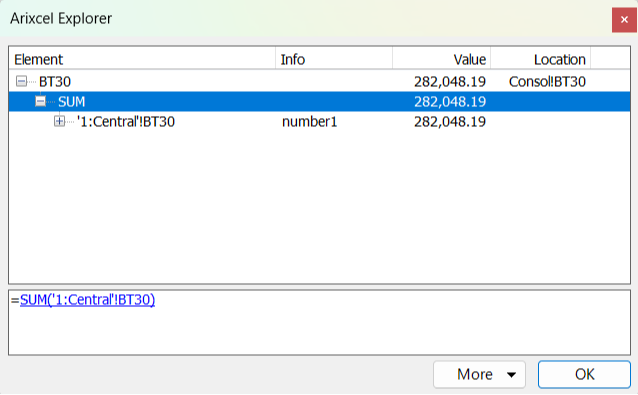
Figure 5: Moving down and right expands the SUM function component
We could navigate down and then right again to reveal each individual cell reference of the 3D reference – see Figure 6. Alternatively, when we initially opened Arixcel with Ctrl + Q in Figure 4, we could press Ctrl + Q again to fully expand everything, producing the same result as Figure 6. Pressing Ctrl + Q a third time collapses everything back to Figure 4.
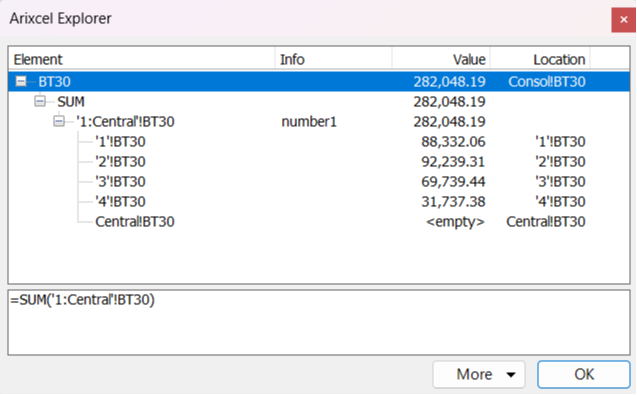
Figure 6: Pressing Ctrl + Q with the first row selected expands the entire formula
Two useful things to note:
- Cycling down or selecting any of the individual cell references, such as ‘2’!BT30 highlighted in Figure 7, instantly navigates to that cell in the workbook. This is Arixcel’s most valuable functionality. It’s a massive timesaver and reduces mental fatigue compared to writing down or remembering cell addresses and manually navigating to them. This is why the PwC modelling team mentioned earlier made the add-in’s use compulsory.
- We have a breakdown of the 282,048 Consol figure in the Value column, allowing us to prioritise our analysis by navigating to the largest figures first – in this case, the 92,239 in ‘2’!BT30.

Learn modelling techniques used in Big 4
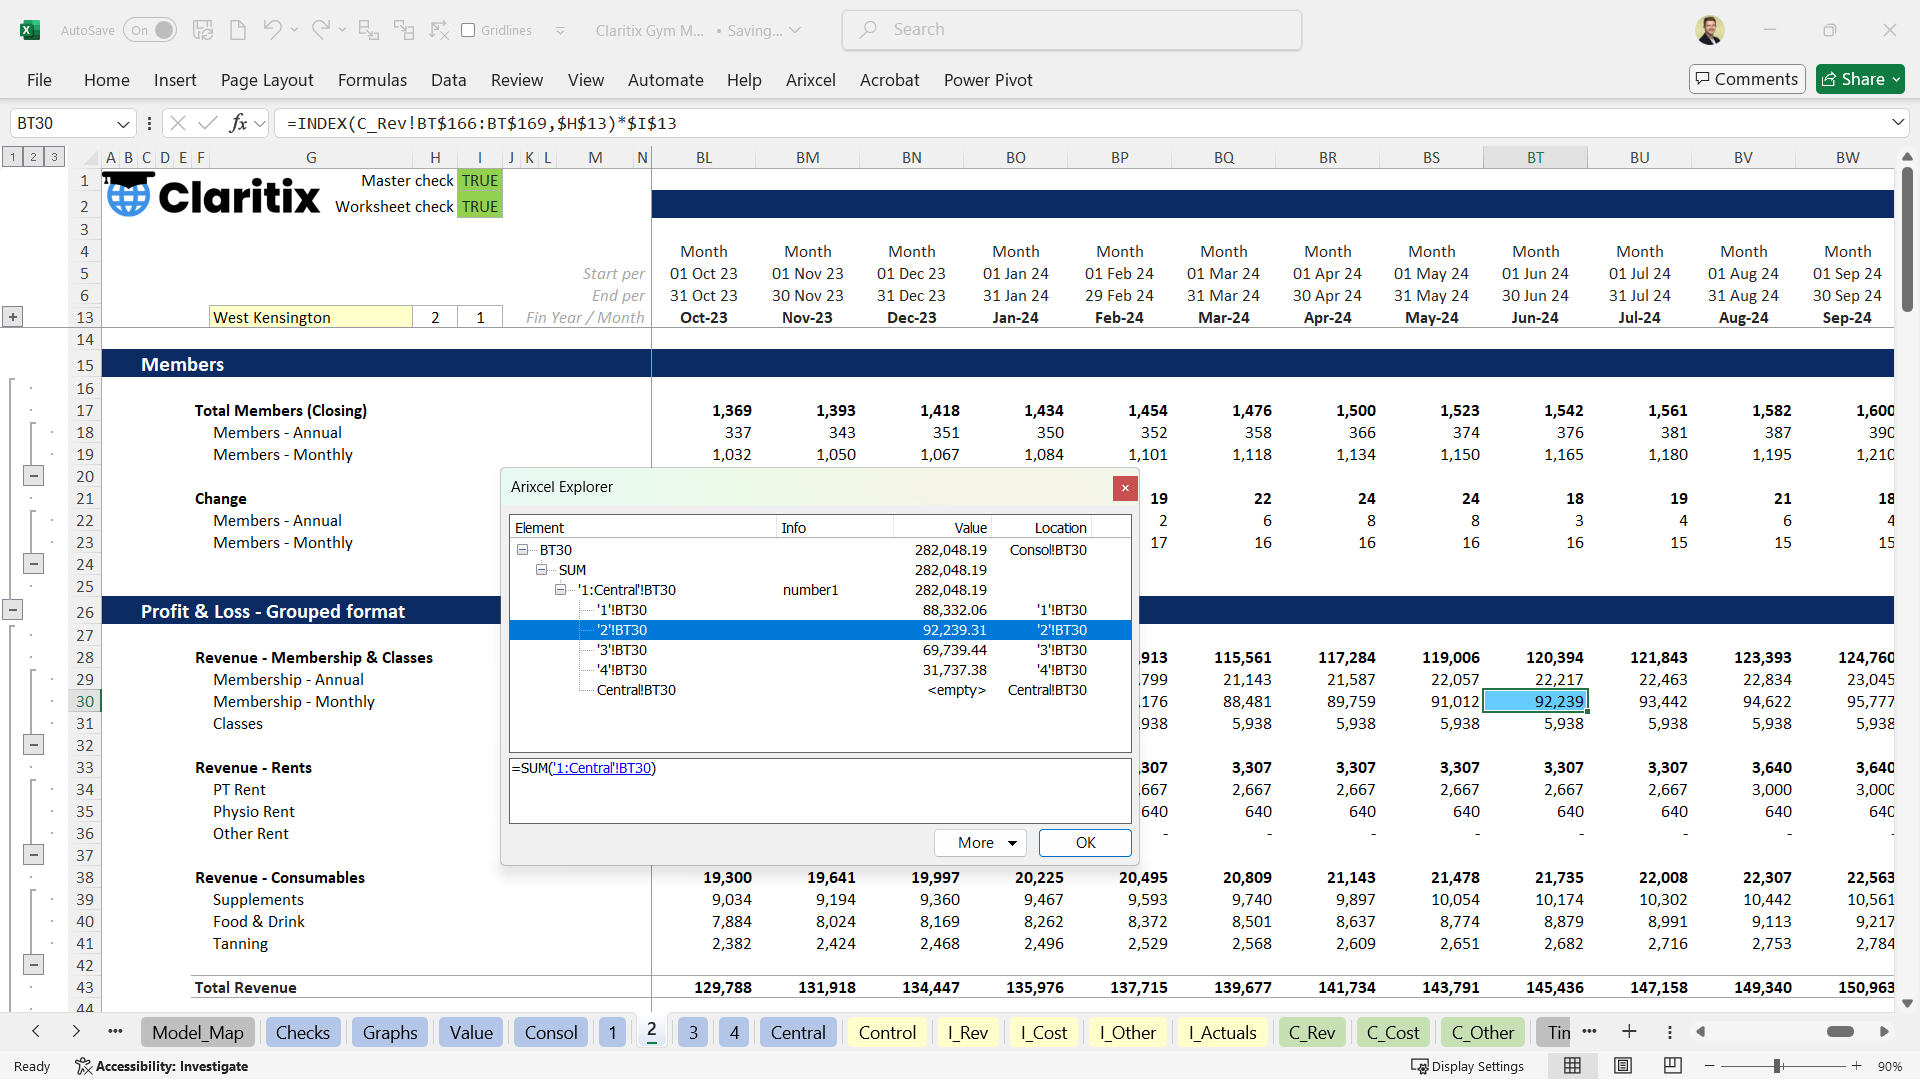
Figure 7: Cycling down Arixcel Explorer instantly navigates to BT30 in worksheet ‘2’.
Continuing the drillthrough
In Figure 7, we have the 92,239 selected in Arixcel Explorer and ‘2’!BT30 is the active cell. To continue our analysis, we can press Ctrl + Q again to open a second Arixcel Explorer – see Figure 8.
We can see the two components of the formula - an INDEX function and a cell reference - broken down over two lines in Arixcel Explorer. The formula at the bottom of Arixcel shows they are multiplied together.
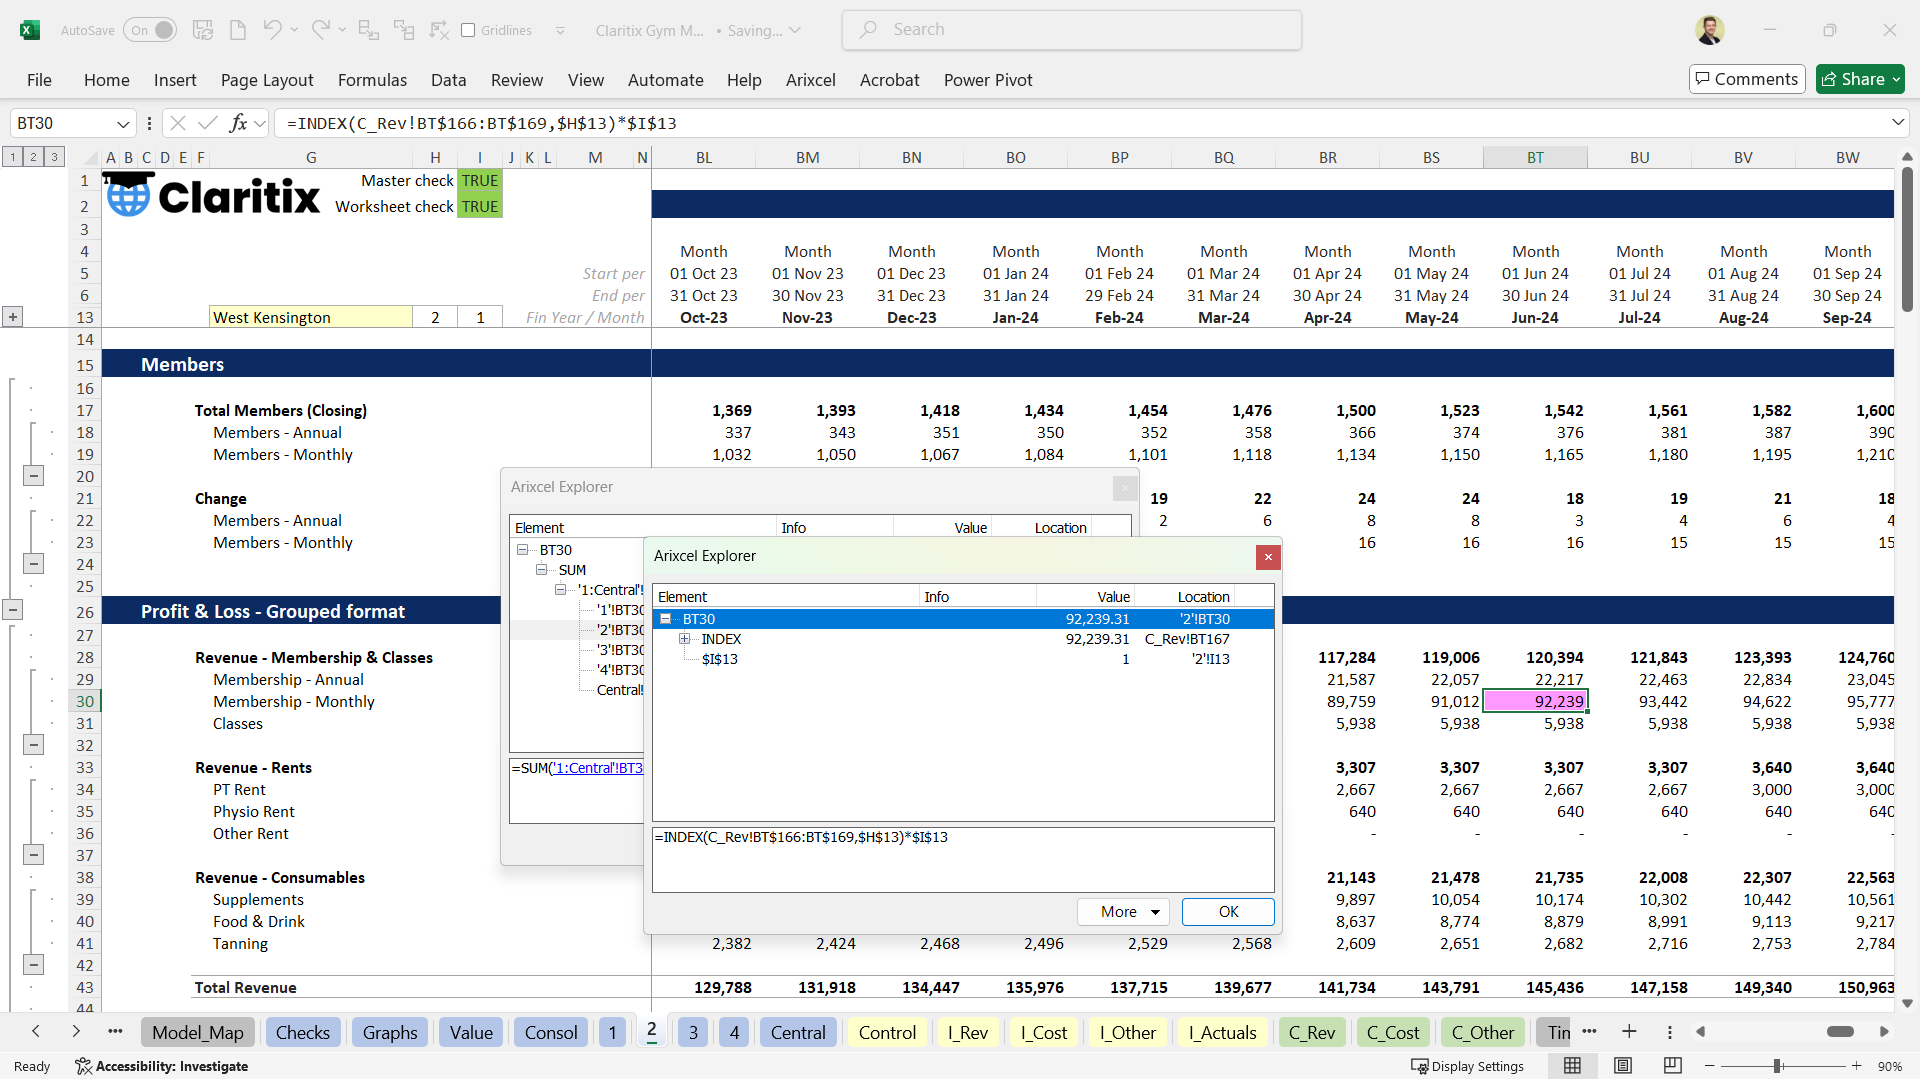
Figure 8: With BT30 in worksheet ‘2’ selected, pressing Ctrl + Q opens a second Arixcel Explorer
Pressing Ctrl + Q again will fully expand the formula, allowing us to cycle down to - and navigate to - the array parameter of the INDEX function, which is highlighted blue in the C_Rev worksheet – see Figure 9.
In this way, we can continue to drill through the model by repeatedly pressing Ctrl + Q, opening a new Arixcel Explorer each time, until we reach the hardcoded assumptions.
Note: the 92,239 in the INDEX row of Arixcel Explorer is the result of the INDEX function. The array used in the INDEX function is C_Rev!BT$166:BT$169 – highlighted blue in the worksheet – and the row coordinate is 2. The second row of the blue highlighted cells is 92,239, which confirms the result.
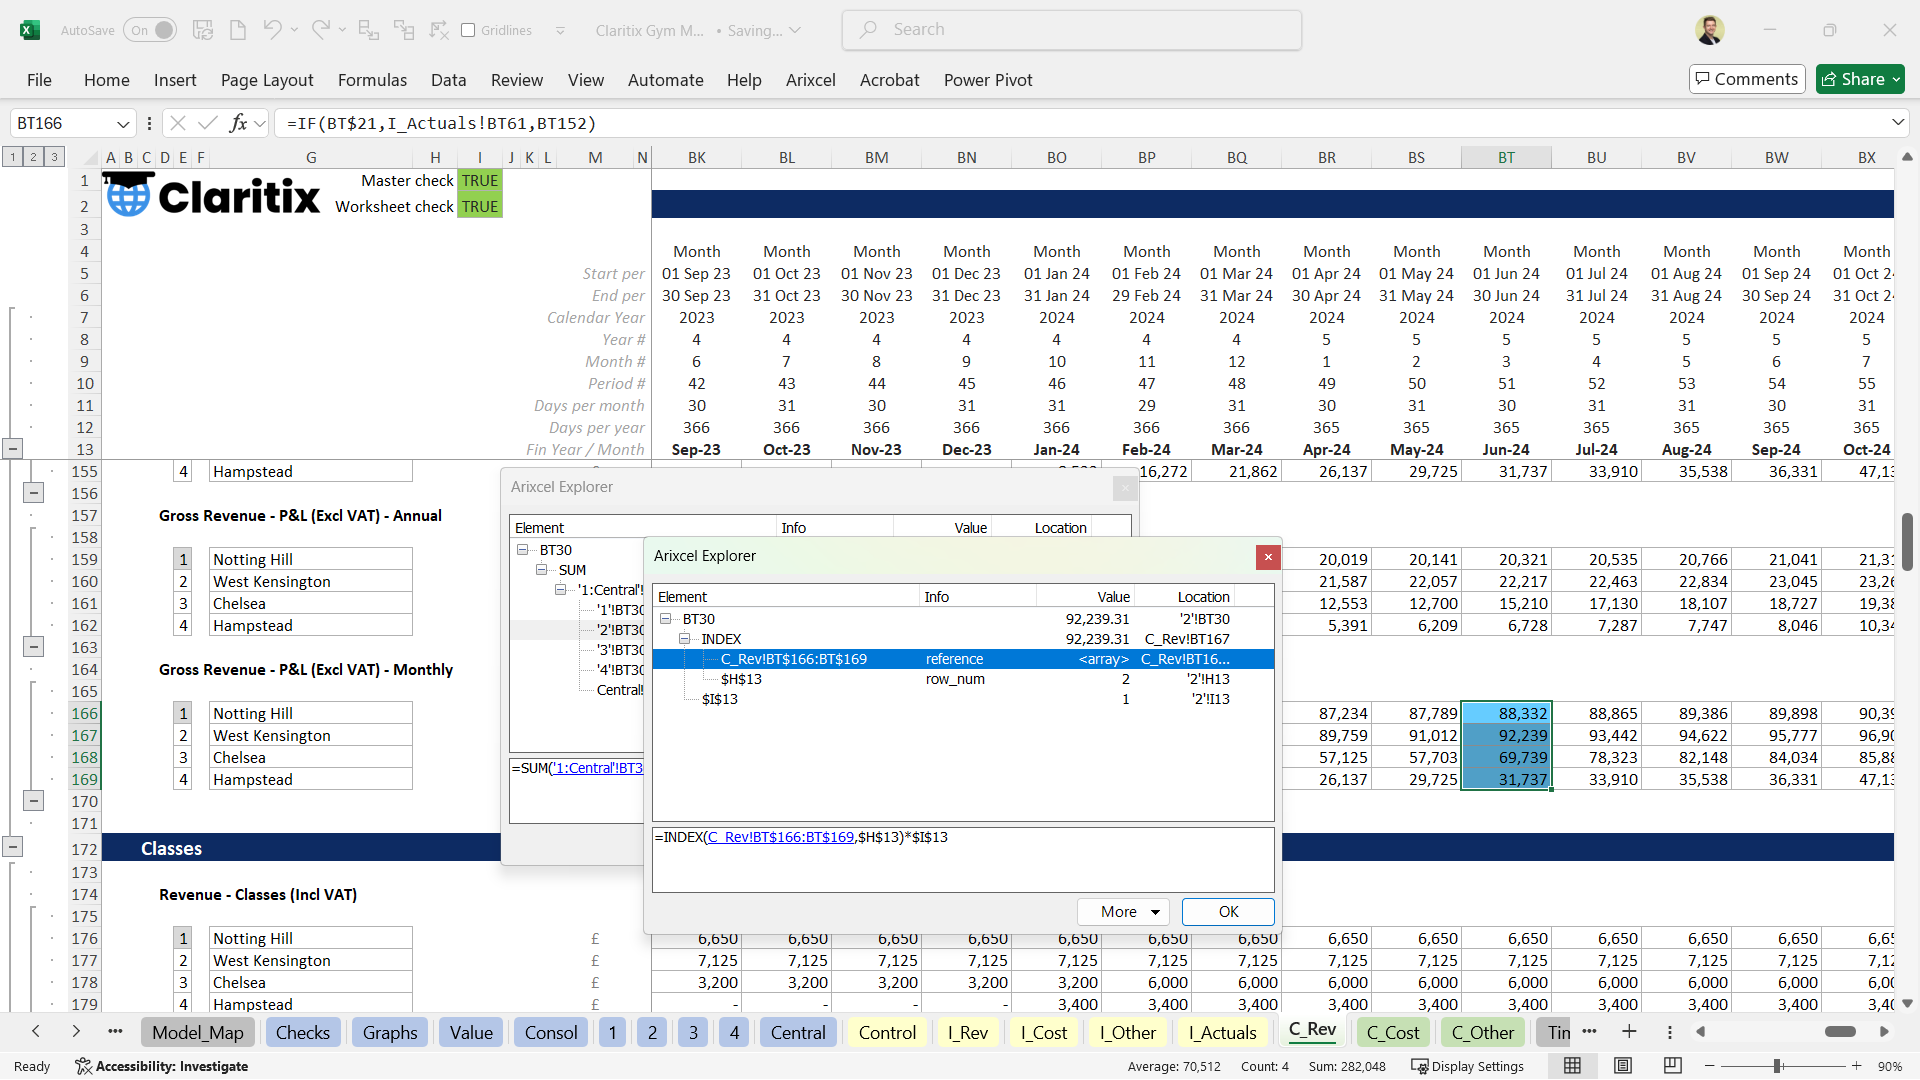
Figure 9: The array component of the INDEX has been selected and navigated to
Closing Arixcel Explorer
To close Arixcel Explorer, we can use the shortcuts mentioned earlier.
Enter – closes the most recent Arixcel Explorer but keeps the most recent selected cells (e.g. the blue-highlighted cells in Figure 9) selected. Repeatedly pressing Enter closes any remaining Arixcel Explorers.
Esc – closes the most recent Arixcel Explorer and reverts the selected cell(s) to those from the previous Arixcel Explorer. Therefore, if we drill through a model from an output worksheet all the way to the ultimate inputs, opening many Arixcel Explorers as we go, then repeatedly pressing Esc is a useful way to take us all the way back to our original starting point.
Alternatively, we can use the mouse to select a cell in the workbook and continue working independently of Arixcel – the Arixcel Explorer window will stay open and can be returned to at any to continue our navigational journey!
Explore Dependents
The opposite of what we’ve covered so far is Explore Dependents. We might want to establish which cells are affected (or dependent) on an input or calculation cell – for example, to understand the model better or assess the impact of deleting a cell.
Explore dependents of a single cell
The value of 106 in cell BD23 in Figure 10 represents monthly new member additions in a gym chain. If we want to investigate its impact on revenue, we can explore dependents to navigate to the model’s members calculations and then onwards to its revenue calculations.
With cell BD23 selected, pressing Ctrl + Shift + Q opens Arixcel Explorer Dependents. This looks similar to Arixcel Explorer, but it is simpler in both operation and functionality.
The first row (highlighted blue) shows the active cell BD23. The subsequent rows list the cell’s dependents, which can be navigated using the keyboard arrow keys.
Note, Arixcel Explorer Dependents includes a Count column showing the number of dependents, and it does not display a formula at the bottom, regardless of whether the cell has a formula or a constant.
👉 Learn a structured approach to creating financial models here
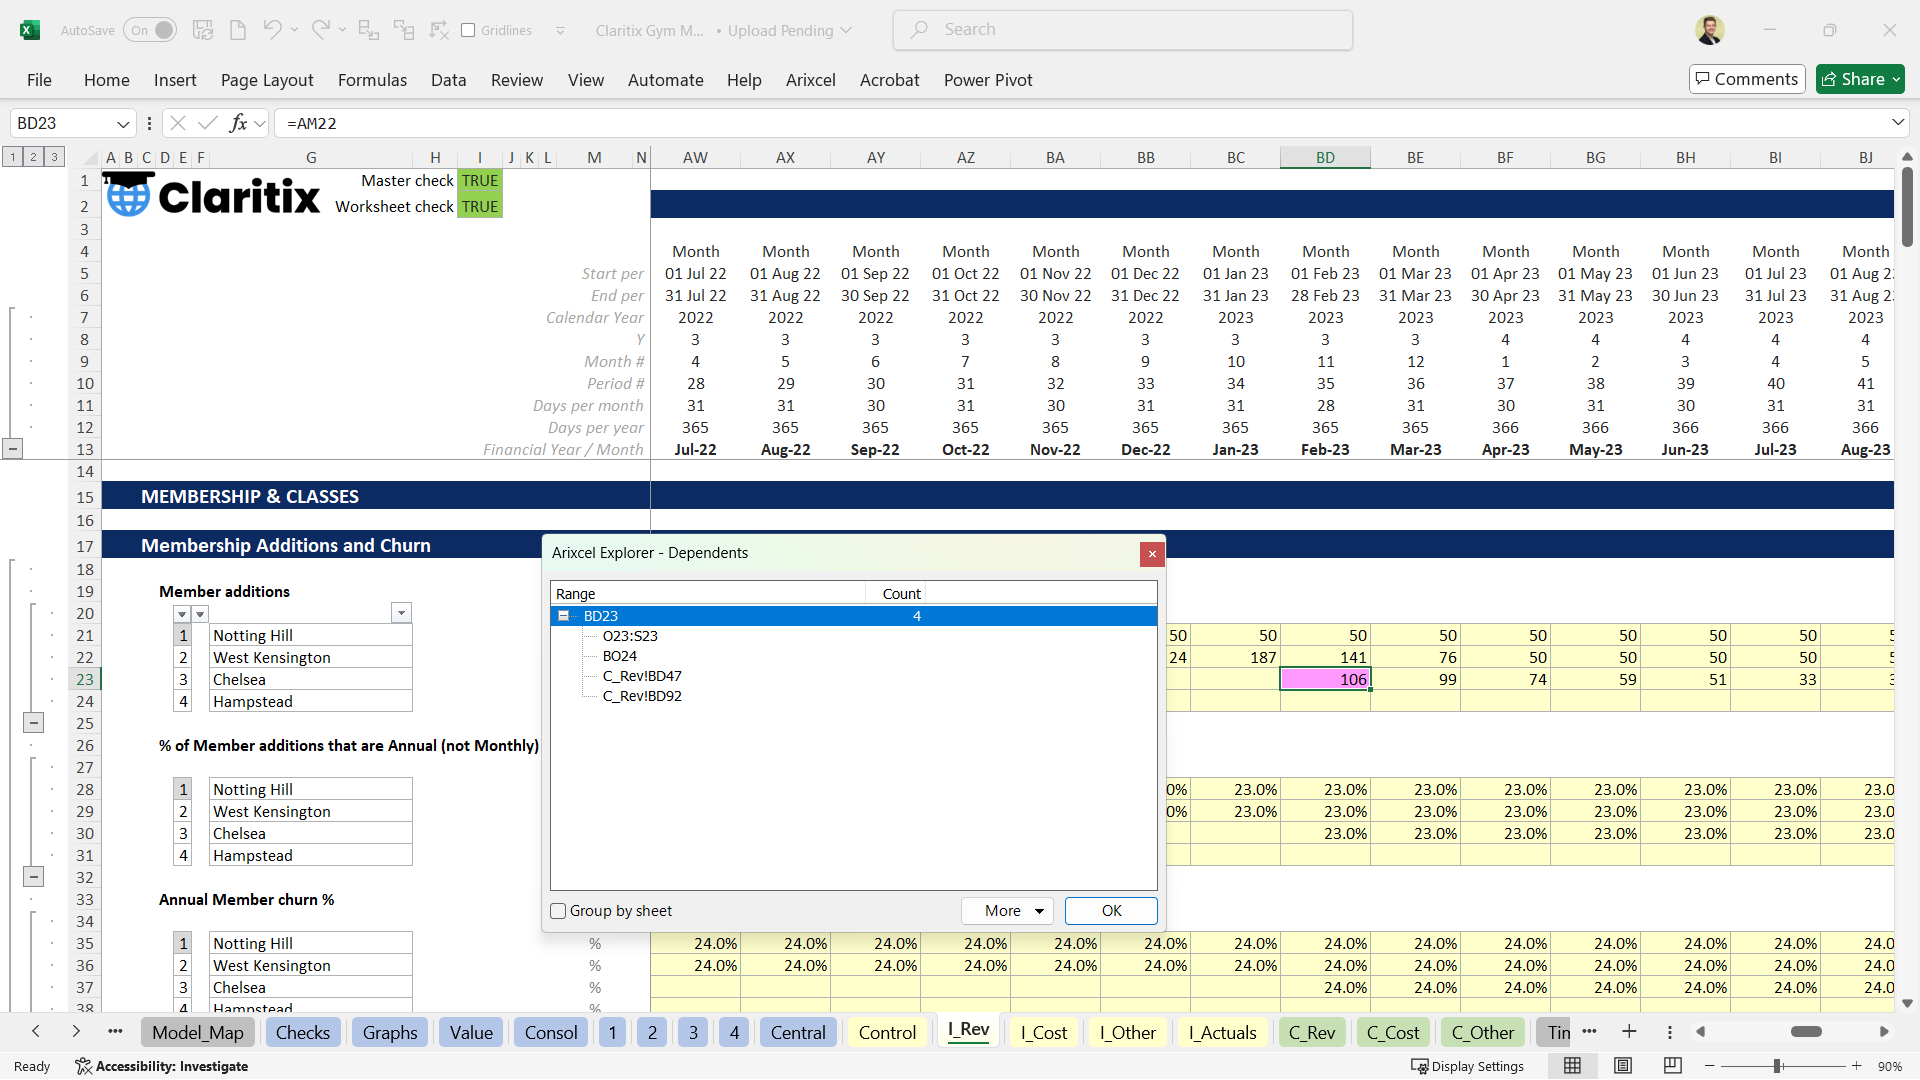
Figure 10: Initial view when launching Arixcel Explorer Dependents on cell BD23 of ‘I_Rev’ worksheet
Explore dependents of multiple cells
The same process can be applied to multiple cells. Selecting a range and pressing Ctrl + Shift +Q will open Arixcel Explorer Dependents, returning a list of all dependents for the selected cells.
This is especially useful when checking whether certain cells can be removed from a model without causing #REF errors.
Warning when using Explore Dependents
Be cautious: some cells can have a very large number of dependents – for instance, if they’re referenced by functions like INDEX or SUMIFS and those calculations are repeated many times. In such cases, Arixcel Explorer Dependents may process thousands of cells and could cause Excel to crash.
This risk is compounded if Explore Dependents is run on multiple cells.
We recommend saving your file before using Explore Dependents, unless you’re very sure of the likely dependents.
Final Thoughts
Despite its relatively simple and limited functionality, Arixcel’s ability to explore precedents and dependents with such speed and clarity makes it a powerful tool for anyone working with Excel financial models or spreadsheets. It saves time, reduces mental fatigue, and ultimately helps us understand the assumptions, calculations, and logic driving our work.
If you're looking to build better financial, strategic, or operational models - not just navigate them - our Excel Modeller course teaches you how to design, build, test, and operate financial models using best-practice approaches adopted by Big 4 modelling teams. You’ll learn structured modelling techniques, in-depth relevant theory, how to avoid common errors, and how to create models that are transparent, robust, and ready for commercial use.