Power Query & Power Pivot in Excel
Stop rebuilding your reports every month-end.
Learn to automate the data preparation, mapping, and calculation behind your financial reports – using tools already installed in Excel. Designed for finance professionals, taught by one.
- Build a working P&L and Sales Dashboard during the course
- Works in Excel – no new software required
- No prior Power Query or Power Pivot experience needed
- Built specifically for accounting & finance professionals
12-month access · No subscription · CPD certificate included
Enrol Now: £325 + VAT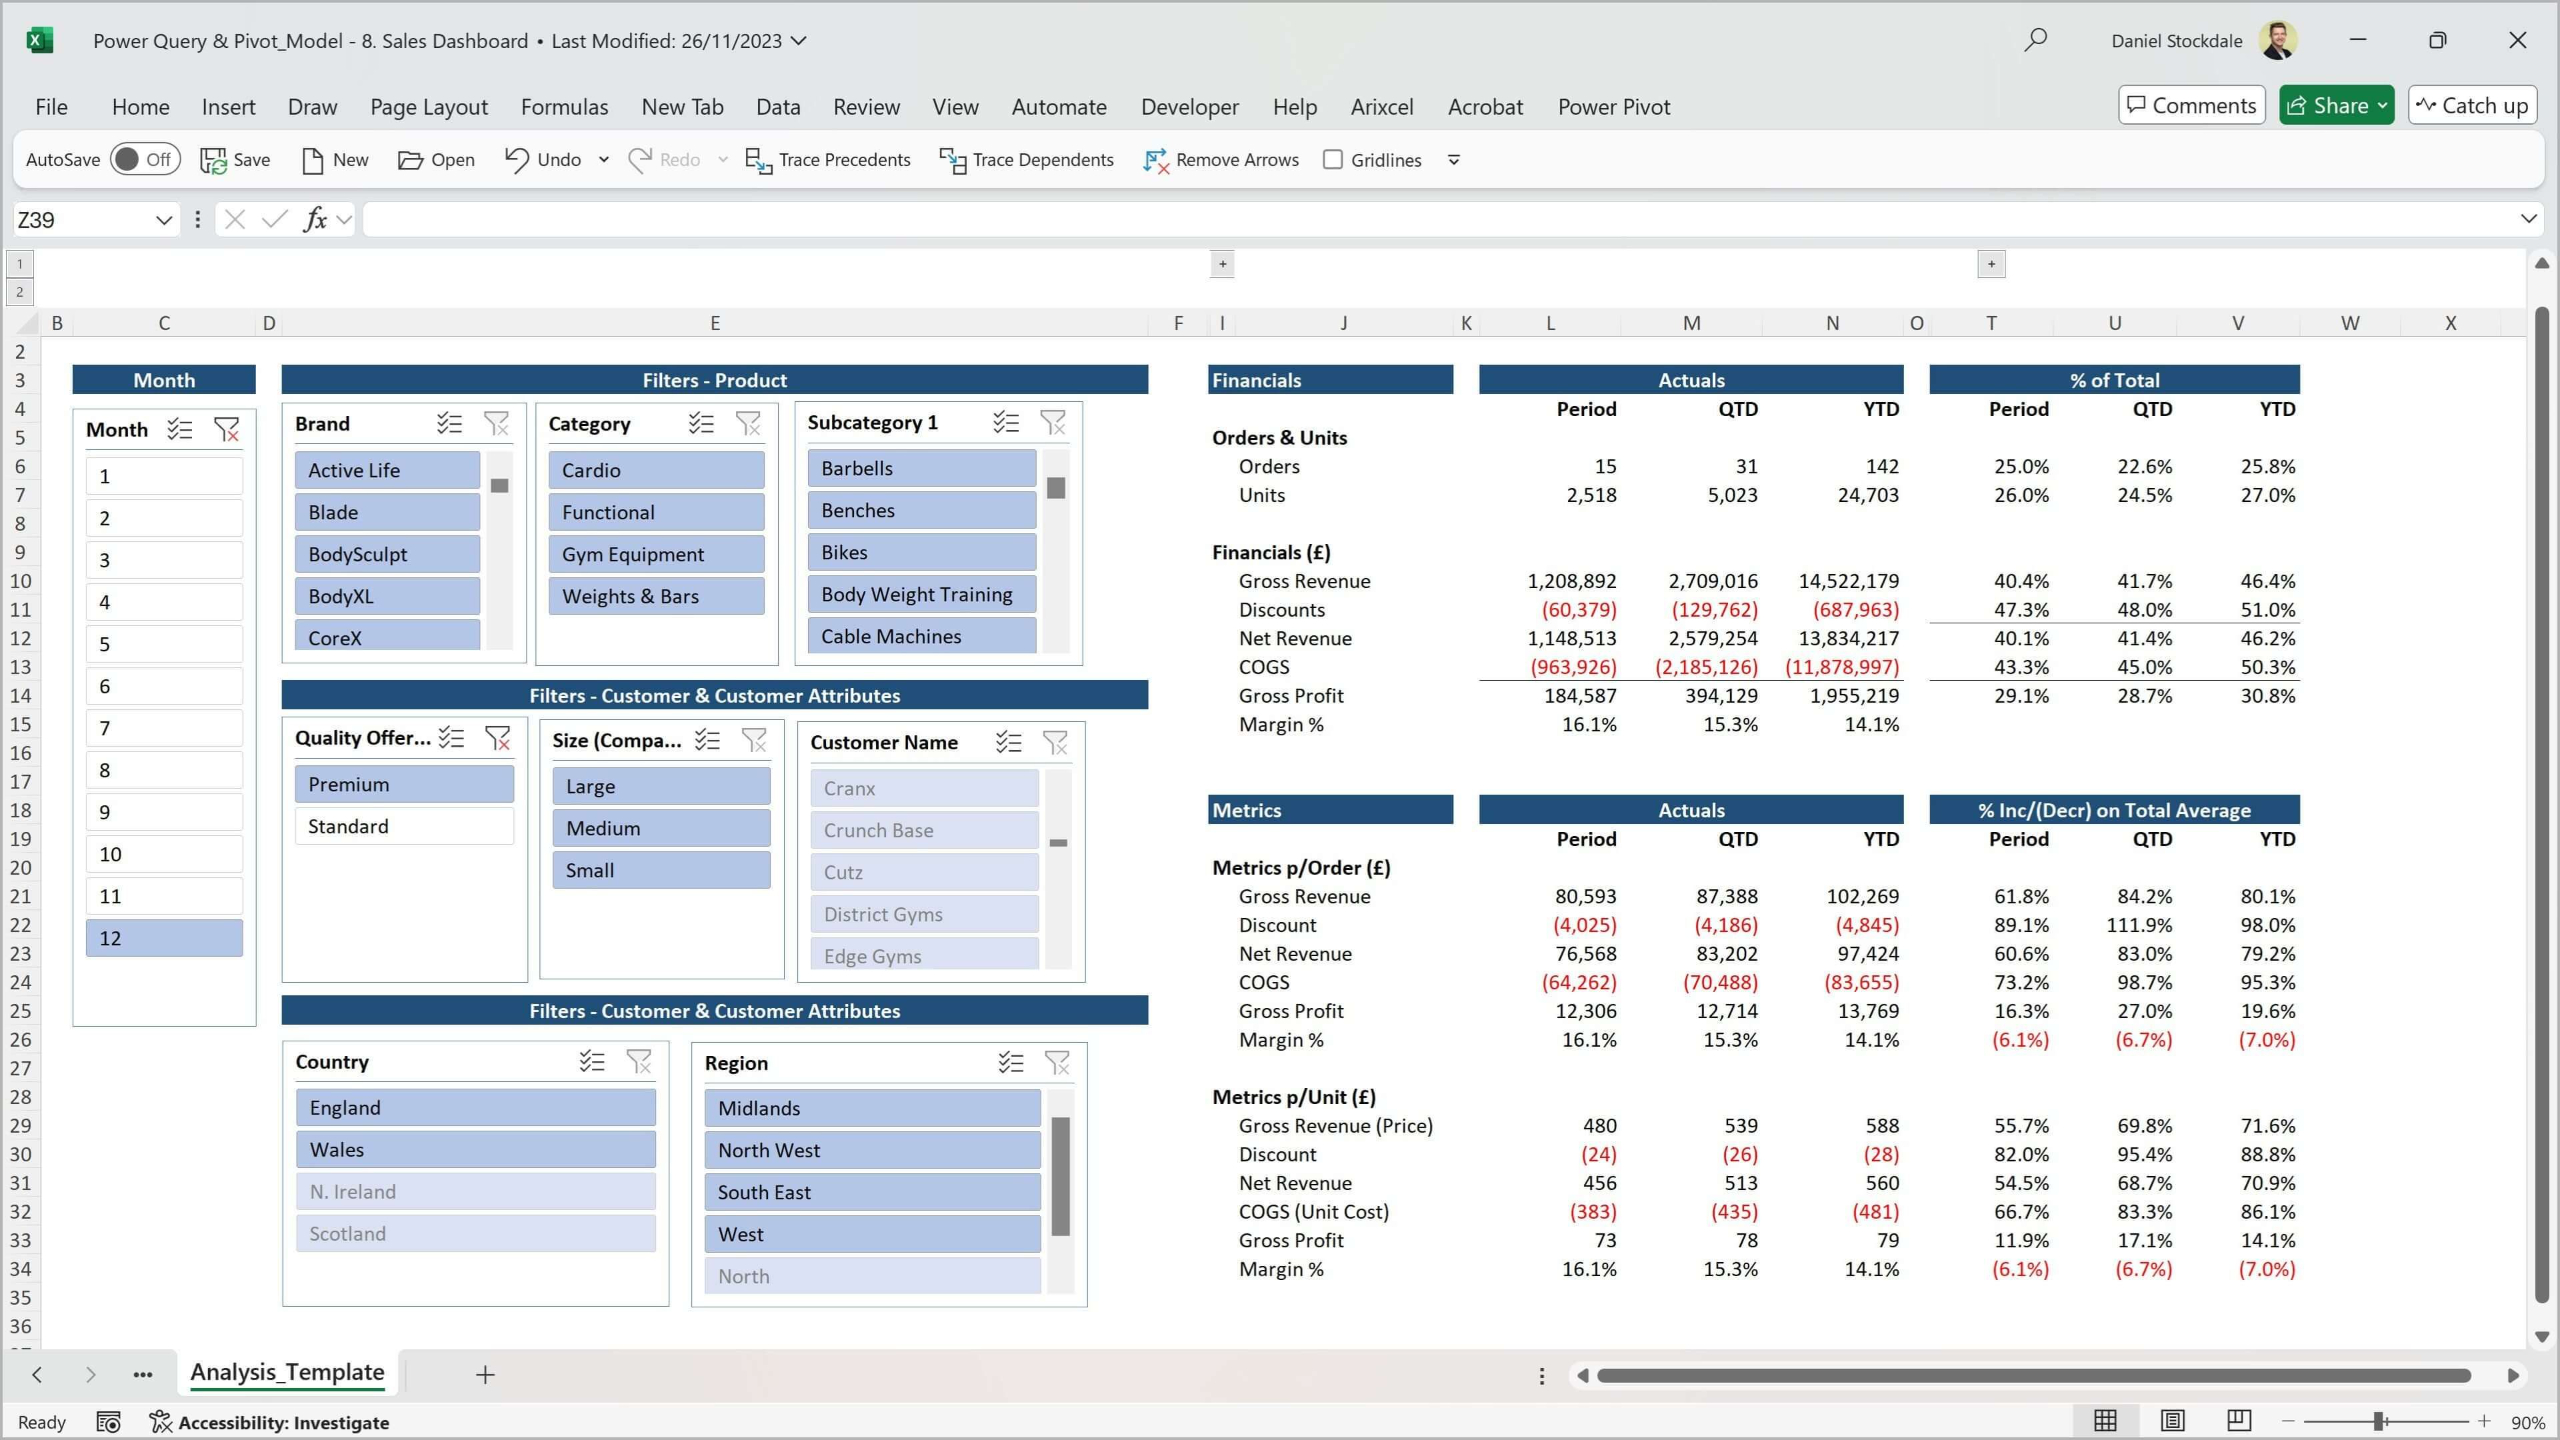


The PROBLEM
Every month, the same problem.
Monthly reporting in most finance teams is still largely manual. The data preparation, the mapping, the calculations – all done by hand, all prone to error, all eating hours you do not have.
✗ Time
Hours wasted on repetitive data preparation every month-end. Download, paste, adjust, check, fix – then repeat.
✗ Risk
Manual processes introduce errors that carry forward into subsequent reports. Data integrity is fragile when humans are the process.
✗ Data limitations
Large datasets slow down or break traditional Excel. Combining data from multiple sources is difficult.
The solution
What if your reports just refreshed?
Power Query and Power Pivot are already installed in your version of Excel. Set them up once – and every month after that, the heavy lifting is done.
✓ Automated
Data extracted, cleaned, mapped, and loaded automatically. Reports refresh at the click of a button.
✓ Robust
Every transformation is recorded and reapplied. Data storage, mapping, and calculation are consistent and auditable.
✓ Flexible
Handle millions of rows. Combine data from multiple sources. Build P&Ls, dashboards, and actuals vs budget reports directly in Excel.
Who this is for
This course is for you if…
Designed for accounting and finance professionals with regular reporting responsibilities.

Finance role
You work in FP&A, management accounting, financial reporting, or a similar finance function

Monthly reporting
You produce regular reports – P&L, management accounts, sales analysis, actuals vs budget
Excel user
Comfortable with Excel formulas but have not yet used Power Query or Power Pivot

Ready to automate
You want reports that refresh automatically when new data arrives
What you need to know already: No prior Power Query or Power Pivot experience required. Intermediate Excel is helpful – if you can write an VLOOKUP/XLOOKUP or SUMIFS, you have what you need. Note: Power Pivot is Windows-only and is not available in Excel for Mac.
Course overview
See what you will build – and the problems it solves.
This six-minute overview shows you the monthly reporting challenges that drive finance professionals to this course, and the reports you will build by the end of it: a Profit & Loss with actuals vs budget, and a Sales Dashboard with product, customer, and period filters.
If you currently produce static reports manually each month, this gives you a direct before-and-after comparison.
▶ 6 minutes · No sign-up required
What you will be able to do
By the end of this course, you will be able to:
The course has two goals: to teach you Power Query and Power Pivot from scratch, and to leave you with working, automated financial reports you can adapt for your own organisation.
✓ Connect to multiple data sources and automate monthly data extraction and clean-up
✓ Transform and reshape data in Power Query without touching the original source
✓ Build a data model in Power Pivot that maps table relationships robustly and reliably
✓ Write DAX measures: Revenue, Gross Profit, Margin %, Period, QTD, and YTD calculations
✓ Build a P&L in Excel with actuals vs budget, forecast, and prior year comparisons
✓ Build a Sales Dashboard with product, customer, geography, and period filters
✓ Add new months of data and refresh all reports with a single click
✓ Work confidently with large datasets – the same technology that underpins Power BI
Course content
What the course covers
6 sections · 4 hours of video · 63-page slide deck · 4 quizzes · Practice files included
Each section begins by framing the reporting problem, then shows exactly how Power Query and Power Pivot solve it. Context is finance-specific throughout.
1. Introduction
2. Import & transform data with Power Query
3. Build the data model with Power Pivot
4. DAX – calculations and measures
5. Build the reports
What is included
Everything you need to learn, practise, and apply
The course is not just video. You get a complete package of materials to support your learning and apply it immediately.

63-page slide deck
The full course theory in one downloadable reference document

Excel workbooks
Files capturing each stage of the course build – follow along or catch up at any point
Realistic datasets
Actuals, budget, forecast 1-3, and prior year financial data, plus customer and product data

4 knowledge quizzes
Test your understanding at each stage of the course

Completion certificate
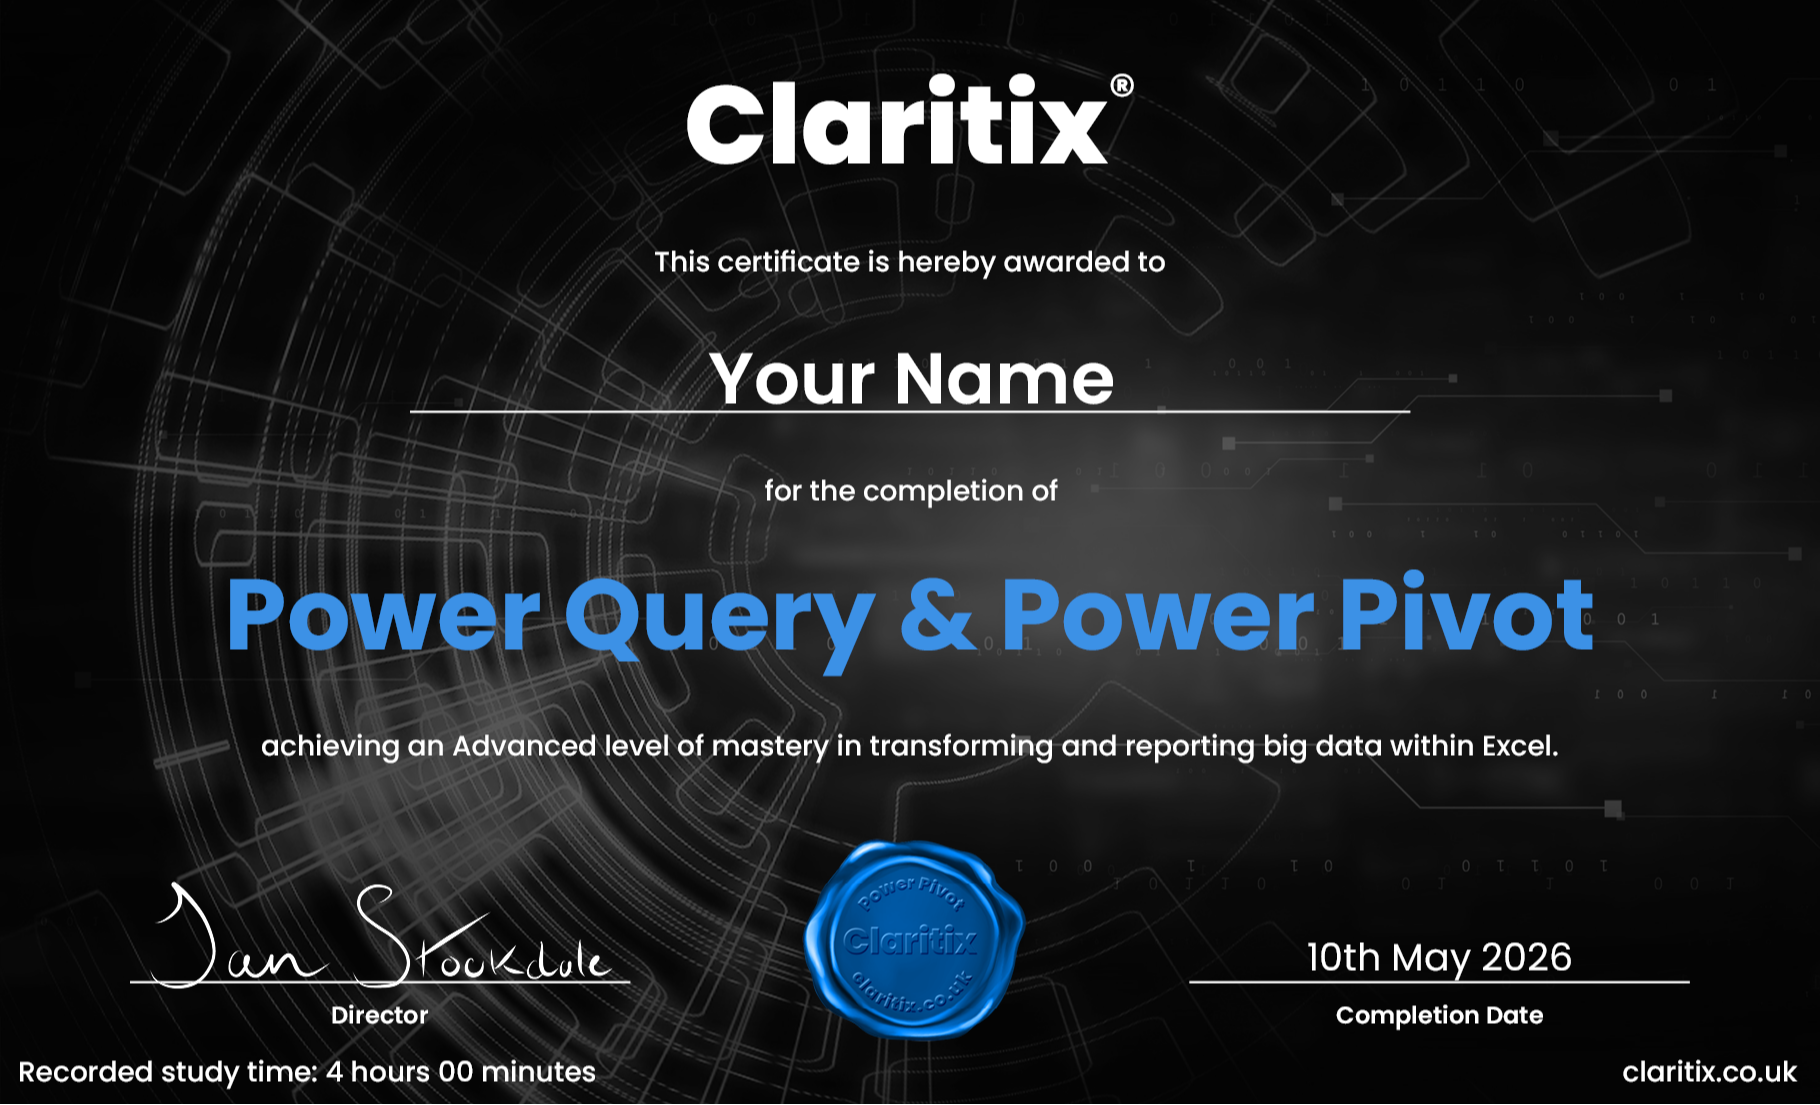
Personalised PDF certificate for CPD records on completion

12-month access
Learn at your own pace – no pressure, no subscription, no auto-renewal
About the course creators
Built by finance professionals, for finance professionals

Dan Stockdale
CIMA-qualified · 15 years in FP&A and financial modelling · Former PwC consultant
Dan built this course because he spent years watching finance teams lose hours every month to manual reporting tasks that Power Query and Power Pivot could eliminate. He wanted a course that taught the tools in the context of real finance work – not generic data examples – and that produced outputs finance professionals actually use: P&Ls, dashboards, actuals vs budget reports.
Oliver Deacon
Former Finance Director, Microsoft Seattle · Finance Leadership Coach
The course has been built in collaboration with Oliver Deacon, who spent several years as a Finance Director at Microsoft in Seattle, where he worked at the cutting edge of leveraging technology and data in financial and commercial reporting.
He experienced firsthand the value generated by using these technologies to redesign processes, raise the quality of output while reducing the time spent doing so, and extract more value and insight from the organisation’s data.

“Finance teams spend hours each month on manual spreadsheet tasks and processes. However, there are two powerful tools included for free with Excel that can greatly enhance efficiency: Power Query and Power Pivot. Despite their potential, over 50% of finance professionals don’t even know they exist!”
Oliver Deacon
Certificate & CPD
Earn a certificate. Support your CPD.
On completing all course modules, you will receive a personalised PDF certificate showing your name, the course title, and your recorded study time. This can be used as supporting evidence towards your Continuing Professional Development requirements.
Whether you are working towards a CIMA, ACCA, ICAEW, or CIPFA CPD commitment, this course provides verifiable evidence of structured learning. A VAT invoice is provided on purchase, making it straightforward to expense through your employer’s training budget.
Free resource
Not ready to enrol yet? Start here for free.
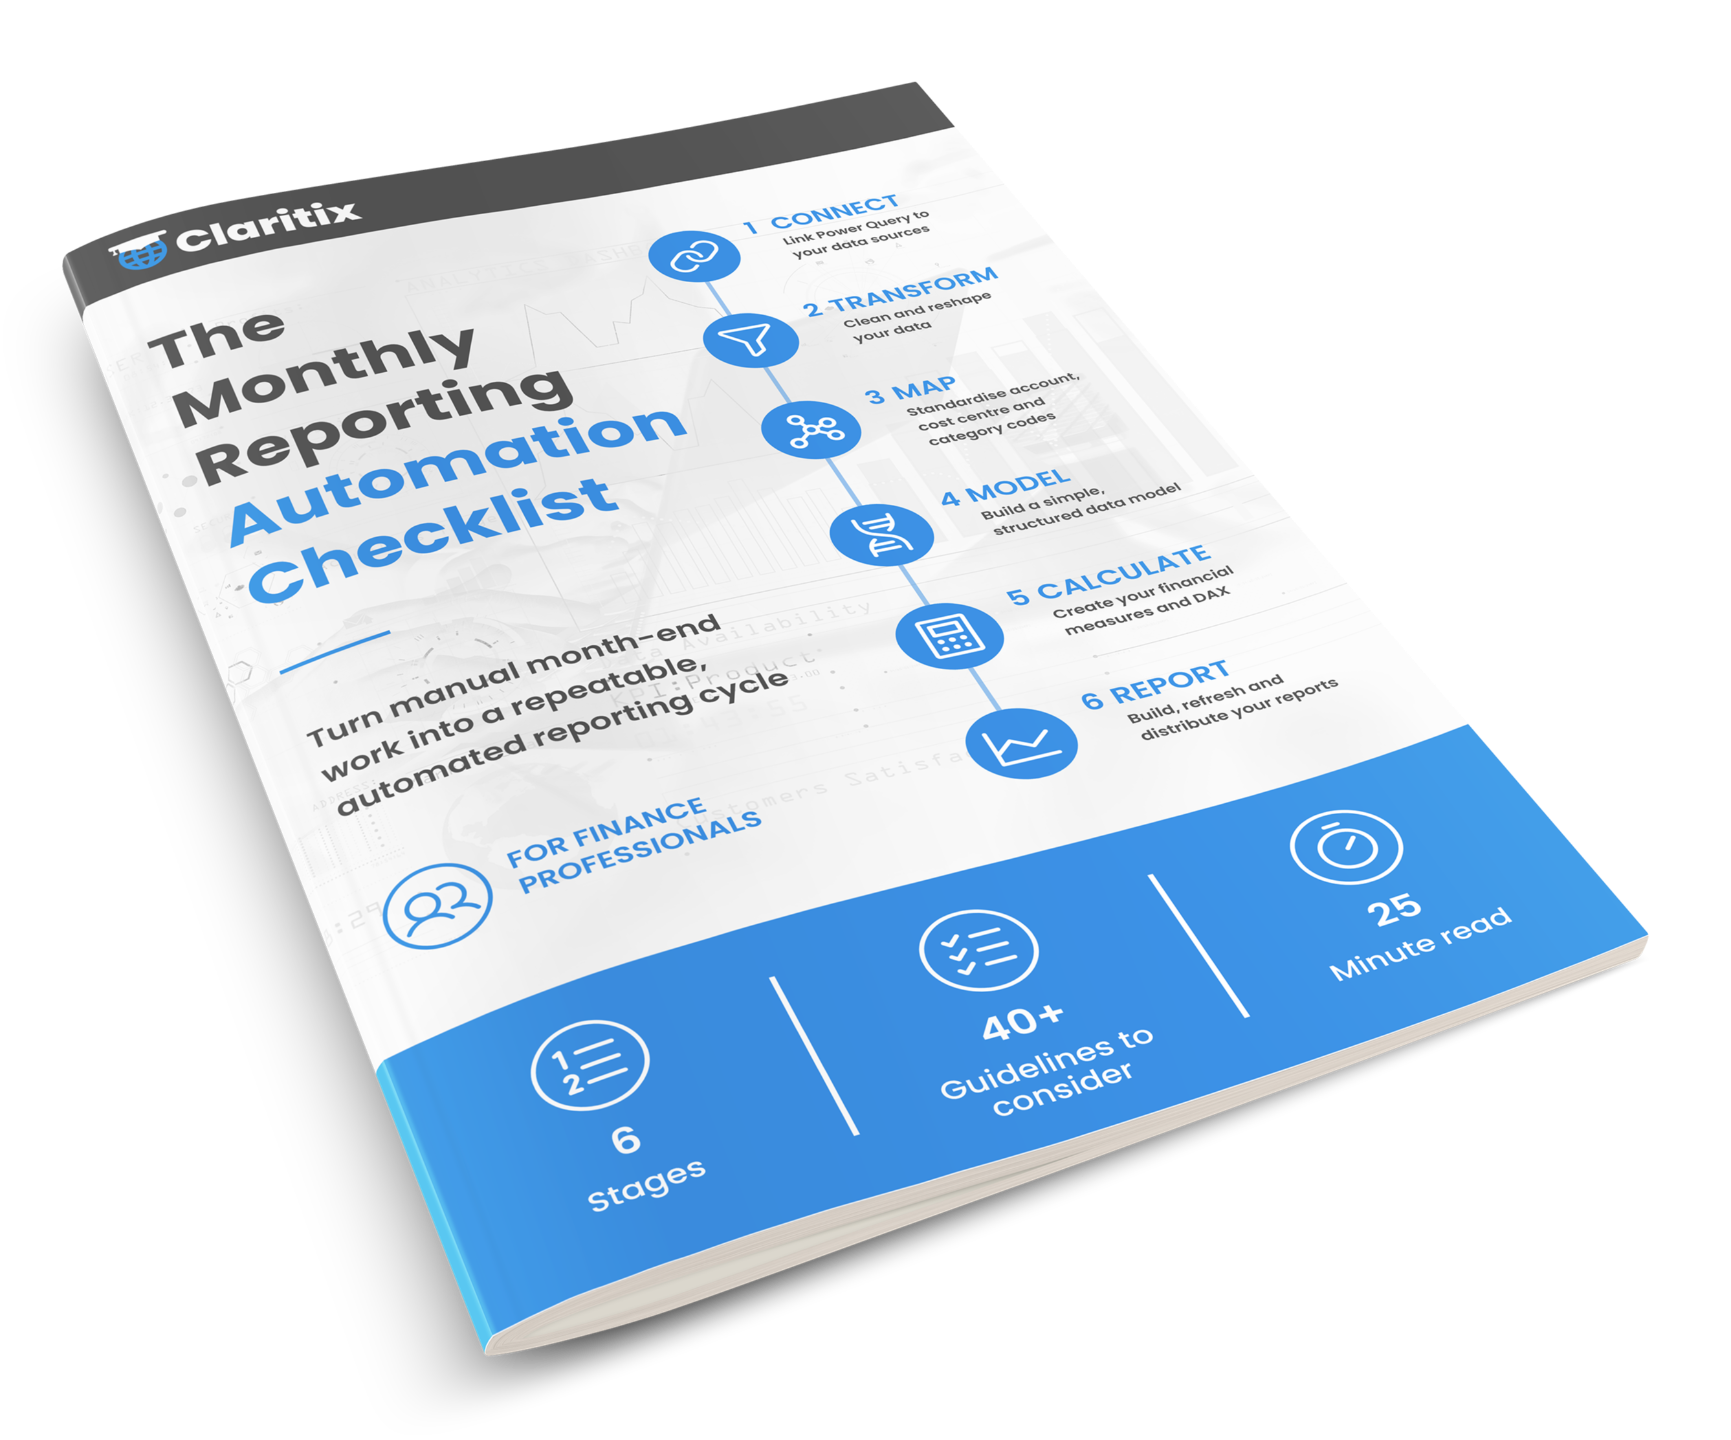
Download the Monthly Reporting Automation Checklist – a free guide to assessing your current process and identifying exactly where Power Query and Power Pivot could save you time each month.
Sign up below and we will send it straight to your inbox. No spam. Unsubscribe at any time.

By subscribing you agree to your data being stored and receiving occasional marketing emails.
Pricing
Invest in yourself
Both options include immediate access to all course materials. Single payment, no subscription, no auto-renewal.
Upgrade to Power Automation Bundle
£575 + VAT
Save up to £245 vs buying separately · 12-month access
Enrol in the Power Automation BundleFAQ
Frequently asked questions
Do I need to know Power Query or Power Pivot already?
Is this suitable if I am an accountant, not a data analyst?
Why not just use Power BI instead?
How long will it take to complete?
Will I get files to work with?
Can I use this for CPD? Can I expense it?
Should I buy this course or the Power Automation Bundle?
What version of Excel do I need?
I already have the Power BI course – can I still buy this one?
Ready to start?
Stop rebuilding your reports every month-end.
Enrol today and get immediate access to the full course, all exercise files, and your 63-page slide deck. Learn at your own pace over 12 months.
12-month access · No subscription · CPD certificate included · Immediate access on purchase